Download
1 / 28
280 likes | 398 Views
Status and Evolution of the 2010-2011 South Central US Drought. Victor Murphy NWS Southern Region Climate Service Program Manager NIDIS Drought Workshop Austin, TX July 7, 2011. Other than Portions of Louisiana, the Southern Plains was Effectively Drought Free on 10/1/10. USDM on 10/5/10.

E N D
Status and Evolution of the 2010-2011 South Central US Drought Victor Murphy NWS Southern Region Climate Service Program Manager NIDIS Drought Workshop Austin, TX July 7, 2011
Other than Portions of Louisiana, the Southern Plains was Effectively Drought Free on 10/1/10
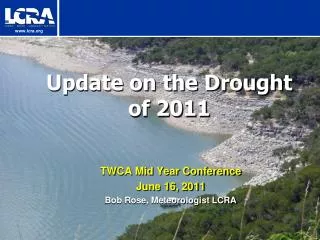
Tropical Cyclones Alex and Hermine Played a Significant Role in This…
….as did the El Nino of 2009/2010. But, Warning Flags were on the Horizon.
Drought Has Always Been A Reoccurring Climatological Cycle for the Southern Plains. Graphs Courtesy of SCIPP.
Drought Has Always Been A Reoccurring Climatological Cycle for the Southern Plains. Graphs Courtesy of SCIPP.
Drought Has Always Been a Reoccurring Climatological Cycle for the Southern Plains. Graphs Courtesy of SCIPP.
Drought Has Always Been a Reoccurring Climatological Cycle for the Southern Plains. Graphs Courtesy of SCIPP
Precipitation Percentile of Non-Exceedence from 10/1/10-5/31/11
18 Month Accumulated Precipitation Departures ending 5/31/11
But Wait, June only gets worse! • Midland and Lubbock had their warmest months ever. Houston and College Station had warmest June ever. • 2nd warmest June on record in Amarillo, Austin, and Waco. • Texas had its warmest June ever, 85.2F, besting 1953 value of 84.9. • Louisiana had its 2nd warmest June ever, behind only 2010.
But Wait, June only gets worse! • Most recent 9 month rainfall total, 8.40”, is the driest 9 month period ever. Previous was 9.36” ending February, 1918. • As per the TX State Climatologist, current drought is now officially the 3rd worst on record (with a bullet!), behind 1951-1957, and 1916-1918, based on the PDSI. • Previous 2 worst droughts peaked in 9/56 and 8/18. Stats through June for all 3 of these droughts are very similar.
But Wait, June only gets worse! Dark line =10 year running average
But wait, June only gets worse. Dark line=10 year running average
Current USDM 91% of TX in Extreme to Exceptional Drought. Worst Ever.
Questions?? Victor Murphy NWS Southern Region Climate Service Program Mgr. 817-978-2652 x 130 Victor.murphy@noaa.gov