Download
1 / 61
610 likes | 613 Views
Explore the use of robust PCA to analyze cornea data, specifically focusing on outliers and elliptical analysis. Discover the benefits of robust PCA in dealing with outliers and examine the effectiveness of elliptical analysis in capturing the curvature of the cornea.

E N D
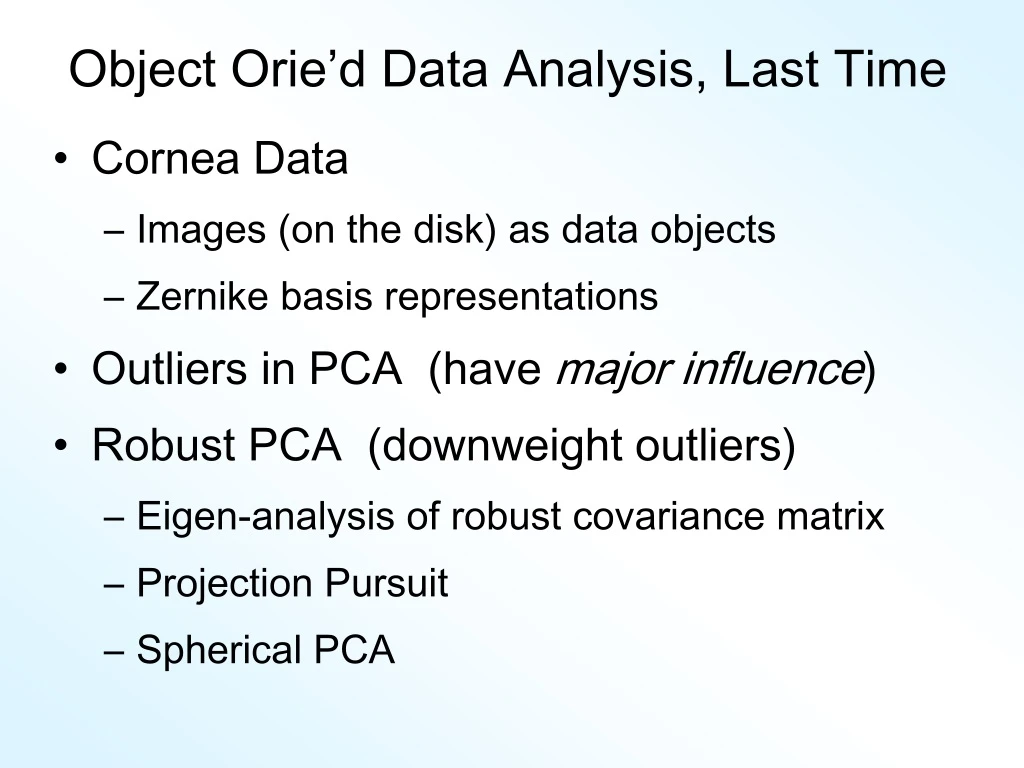
Object Orie’d Data Analysis, Last Time • Cornea Data • Images (on the disk) as data objects • Zernike basis representations • Outliers in PCA (have major influence) • Robust PCA (downweight outliers) • Eigen-analysis of robust covariance matrix • Projection Pursuit • Spherical PCA
Cornea Data Cornea: Outer surface of the eye Driver of Vision: Curvature of Cornea Sequence of Images Objects: Images on the unit disk Curvature as “Heat Map” Special Thanks to K. L. Cohen, N. Tripoli, UNC Ophthalmology
PCA of Cornea Data PC2 Affected by Outlier: How bad is this problem? View 1: Statistician: Arrggghh!!!! • Outliers are very dangerous • Can give arbitrary and meaningless dir’ns • What does 4% of MR SS mean???
Robust PCA What is multivariate median? • There are several! (“median” generalizes in different ways) • Coordinate-wise median • Often worst • Not rotation invariant (2-d data uniform on “L”) • Can lie on convex hull of data (same example) • Thus poor notion of “center”
Robust PCA M-estimate (cont.): “Slide sphere around until mean (of projected data) is at center”
Robust PCA M-estimate (cont.): Additional literature: Called “geometric median” (long before Huber) by: Haldane (1948) Shown unique for by: Milasevic and Ducharme (1987) Useful iterative algorithm: Gower (1974) (see also Sec. 3.2 of Huber). Cornea Data experience: works well for
Robust PCA Robust PCA 3: Spherical PCA
Robust PCA Recall M-estimate for Cornea Data: Sample Mean M-estimate • Definite improvement • But outliers still have some influence • Projection onto sphere distorts the data
Robust PCA Useful View: Parallel Coordinates Plot X-axis: Zernike Coefficient Number Y-axis: Coefficient
Robust PCA Spherical PCA Problem: Magnification of High Freq. Coeff’s Solution: Elliptical Analysis • Main idea: project data onto suitable ellipse, not sphere • Which ellipse? (in general, this is problem that PCA solves!) • Simplification: Consider ellipses parallel to coordinate axes
Robust PCA Rescale Coords Spherical PCA Unscale Coords
Robust PCA Elliptical Analysis (cont.): • Simple Implementation, via coordinate axis rescaling • Divide each axis by MAD • Project Data to sphere (in transformed space) • Return to original space (mul’ply by orig’l MAD) for analysis • Where MAD = Median Absolute Deviation (from median) (simple, high breakdown, outlier resistant measure of “scale”)
Robust PCA Elliptical Estimate of “center”: Do M-estimation in transformed space (then transform back) Results for cornea data: Sample Mean Spherical Center Elliptical Center • Elliptical clearly best • Nearly no edge effect
Robust PCA Elliptical PCA for cornea data: Original PC1, Elliptical PC1 • Still finds overall curvature & correlated astigmatism • Minor edge effects almost completely gone Original PC2, Elliptical PC2 • Huge edge effects dramatically reduced • Still find steeper superior vs. inferior
Robust PCA Elliptical PCA for Cornea Data (cont.): Original PC3, Elliptical PC3 • -Edge effects greatly diminished • But some of against the rule astigmatism also lost • Price paid for robustness Original PC4, Elliptical PC4 • Now looks more like variation on astigmatism???
Robust PCA Current state of the art: • Spherical & Elliptical PCA are a kludge • Put together by Robustness Amateurs • To solve this HDLSS problem • Good News: Robustness Pros are now in the game: Hubert, et al (2005)
Robust PCA Disclaimer on robust analy’s of Cornea Data: • Critical parameter is “radius of analysis”, • : Shown above, Elliptical PCA very effective • : Stronger edge effects, Elliptical PCA less useful • : Edge effects weaker, don’t need robust PCA
Big Picture View of PCA Above View: PCA finds optimal directions in point cloud • Maximize projected variation • Minimize residual variation (same by Pythagorean Theorem) Notes: • Get useful insights about data • Shows can compute for any point cloud • But there are other views.
Big Picture View of PCA Alternate Viewpoint: Gaussian Likelihood • When data are multivariate Gaussian • PCA finds major axes of ellipt’al contours of Probability Density • Maximum Likelihood Estimate Mistaken idea: PCA only useful for Gaussian data
Big Picture View of PCA Simple check for Gaussian distribution: • Standardized parallel coordinate plot • Subtract coordinate wise median (robust version of mean) (not good as “point cloud center”, but now only looking at coordinates) • Divide by MAD / MAD(N(0,1)) (put on same scale as “standard deviation”) • See if data stays in range –3 to +3
Big Picture View of PCA E.g. Cornea Data: Standardized Parallel Coordinate Plot
Big Picture View of PCA Check for Gaussian dist’n: Stand’zed Parallel Coord. Plot • E.g. Cornea data (recall image view of data) • Several data points > 20 “s.d.s” from the center • Distribution clearly not Gaussian • Strong kurtosis • But PCA still gave strong insights
Correlation PCA A related (& better known) variation of PCA: Replace cov. matrix with correlation matrix I.e. do eigen analysis of Where
Correlation PCA Why use correlation matrix? Reason 1: makes features “unit free” • e.g. M-reps: mix “lengths” with “angles” (degrees? radians?) • Are “directions in point cloud” meaningful or useful? • Will unimportant directions dominate?
Correlation PCA Alternate view of correlation PCA: Ordinary PCA on standardized (whitened) data I.e. SVD of data matrix Distorts “point cloud” along coord. dir’ns
Correlation PCA Reason 2 for correlation PCA: • “Whitening” can be a useful operation (e.g. M-rep Corp. Call. data) • Caution: sometimes this is not helpful (can lose important structure this way) E.g. 1: Cornea data Elliptical vs. Spherical PCA
Correlation PCA E.g. 2: Fourier Boundary Corp. Call. Data • Recall Standard PC1, PC2, PC3: • Gave useful insights • Correlation PC1, PC2, PC3 • Not useful directions • No insights about population • Driven by high frequency noise artifacts • Reason: whitening has damped the important structure • By magnifying high frequency noise
Correlation PCA Parallel coordinates show what happened: Most Variation in low frequencies Whitening gives major distortion Skews PCA towards noise directions
Correlation PCA Summary on correlation PCA: • Can be very useful (especially with noncommensurate units) • Not always, can hide important structure • To make choice: Decide whether whitening is useful • My personal use of correlat’n PCA is rare • Other people use it most of the time
PCA to find clusters Toy Example (2 clusters)
PCA to find clusters Toy Example (2 clusters) • Dominant direction finds very distinct clusters • Skewer through meatballs (in point cloud space) • Shows up clearly in scores plot • An important use of scores plot is finding such structure
PCA to find clusters Recall Toy Example with more clusters:
PCA to find clusters Best revealed by 2d scatterplots (4 clusters):
PCA to find clusters Caution: there are limitations… • Revealed by NCI60 data • Recall Microarray data • With 8 known different cancer types • Could separate out clusters • Using specialized DWD directions • But can these be found using PCA? • Recall only finds dirn’s of max variation • Does not use class label information
PCA to find clusters Specific DWD directions, for NCI60 Data: Good Separation Of Cancer Types
PCA to find clusters PCA directions, for NCI60 Data: See clusters? PC2? PC1-3?
PCA to find clusters PCA directions, for NCI60 Data: PC2: Melanoma PC1-3 Leukemia
PCA to find clusters PC5-8 directions, for NCI60 Data: See clusters? PC5? Others?
PCA to find clusters PC5-8 directions, for NCI60 Data: PC5: Leukemia & Renal PC6: CNS???
PCA to find clusters PC9-12 directions, for NCI60 Data: See clusters? Maybe Not???
PCA to find clusters PC9-12 directions, for NCI60 Data: Some New Combos ???
PCA to find clusters Off Diagonal PC1-4 & 5-8, NCI60 Data: See clusters? PC1 & 5 PC2
PCA to find clusters Off Diagonal PC1-4 & 5-8, NCI60 Data: PC1 & 5 Renal Leukemia (separated) PC2: Melanoma
PCA to find clusters Off Diagonal PC1-4 & 9-12, NCI60 Data: See clusters? PC2 Others???
PCA to find clusters Off Diagonal PC1-4 & 9-12, NCI60 Data: PC2 Melanoma PC1 Colon???
PCA to find clusters Off Diagonal PC5-8 & 9-12, NCI60 Data: See clusters? PC5 Others???
PCA to find clusters Off Diagonal PC5-8 & 9-12, NCI60 Data: PC5 Leukemia & Renal Others???
PCA to find clusters Main Lesson: PCA is limited a finding clusters • Revealed by NCI60 data • Recall Microarray data • With 8 known different cancer types • PCA does not find all 8 clusters • Recall only finds dirn’s of max variation • Does not use class label information
PCA to find clusters A deeper example: Mass Flux Data • Data from Enrica Bellone, • National Center for Atmospheric Research • Mass Flux for quantifying cloud types • How does mass change when moving into a cloud
PCA to find clusters PCA of Mass Flux Data: