Download
1 / 25
250 likes | 255 Views
Chapter 1 Microeconomics: A Working Methodology. The economic environment poses many complex questions. The only way to understand economic behaviour is to find a method for setting out and then solving microeconomic problems.

E N D
The economic environment poses many complex questions. • The only way to understand economic behaviour is to find a method for setting out and then solving microeconomic problems. • This methodology consists of a relatively small set of ideas that are applicable to a vast number of situations. • Throughout this book, you will be introduced to the ideas of economic analysis and shown how to use them to answer many economic questions.
A Water Shortage Problem • An imaginary island is subdivided into the 100-home Estates. • Water for these homes comes from a series of wells owned by the Estates Water District at a total cost of $50 000 per year. • Every household pays a flat fee of $500 per year for water (non-metered scheme).
A Water Shortage problem • All householders are identical and the typical household uses 80 000 litres of water over July and August. • Water is sometimes unavailable in August. • The householder currently has an unbalanced water use profile consisting of 60 000 litres in July and 20 000 in August.
A Water Shortage Problem • The householder would actually prefer to consume 40 000 litres of water in each of July and August (the balanced water profile). • However, the householder cannot achieve the preferred water profile by his/her own effort, even though total water consumption under both profiles is the same.
A Water Shortage problem • To see why, suppose just one householder reduces personal water use from 60 000 to 40 000 litres in July, leaving 20 000 additional litres for August. • In August, this water conserving household would get only 1/100 (2 000 litres) of this additional water as all other household draw on the extra water supply. • Figure 1.1 shows all the water use profiles the householder can personally achieve under the non-metered scheme.
From Figure 1.1 • What is the most preferred water profile along DCU? • Because all 100 householders see the problem in the same way, they find an equilibrium at 60 000 litres in July and 20 000 litres in August. • There is nothing an individual householder by himself can do to attain a more preferred profile.
From Figure 1.1 • However, this equilibrium is unattractive. Even though total water usage is the same, every householder would prefer to consume the balanced profile of 40 000 litres in each July and August. • Put differently, each householder could be better off if there were some way to induce everyone to save 20 000 litres in July for use in August.
A Water Monitoring Scheme • A metered water scheme, where the price was sufficient to reduce July consumption, could bring about the balanced water profile. • If it costs nothing to monitor water consumption, all revenues raised by the per litre charge could be used to reduce the householders fixed yearly fee.
A Water Monitoring Scheme • Monitoring is not costless. • The expense of collecting fees, must be compared with the benefits of balanced water use. • Such a comparison will determine if the water monitoring scheme is preferable to the non-monitored scenario.
Common Property Problems • The water shortage problem is referred to as a common property problem. • In the non-metered scheme, the district’s wells are common property and there is insufficient incentive to curb water usage. • With the metered scheme, the wells become private property, the water is sold to users, and the cost of usage provides incentives for conservation.
From Figure 1.3 • Note the equilibrium price is the only price where the quantity demanded equals the quantity supplied. • At prices below the equilibrium price there exists excess demand. • At prices above the equilibrium price there exists excess supply.
Agricultural Price Supports • From Figure 1.3, in absence of government intervention we would expects to see an equilibrium price of $5. • Now, let’s suppose the Agricultural Price Support Authority (ASPA) wants to support a price that is higher than the equilibrium. • Figure 1.3 examines two price support programs: 1) Buy and store program, 2) Price subsidy program.
Agricultural Price Supports • In a Buy and store program, the government offers to buy butter at the support price and then stores all butter it buys, removing it from the market. • The support authority will have to buy and store the difference between the quantity demanded and the quantity supplied at the support price.
Agricultural Price Supports • In a price subsidy program, the butter producers sell butter in the market place for whatever price they can get. • The support authority then pays producers a subsidy equal to the difference between the support price and the market price.
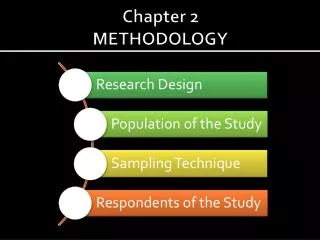
Describing an Economy: Four Building Blocks • Resource endowment consists of all resources available to an economy. • Technology specifies how resources can be used to produce goods. • Preferences of individuals determine what goods are produced in an economy. • Institutions are the rules by which the economic “game” is played.
The Equilibrium Method • An equilibrium consists of a set of choices for the individuals and a corresponding social state such that no individual can be better off by making some other choice. • Comparative static analysis is the method of analyzing the impact of a change by comparing the equilibrium resulting from that change with the original equilibrium.
Positive and Normative Economics • Positive economics is concerned with factual matters. The answers to positive economic questions can be settled by factual observation. • Normative economics involves value judgments. The answers to normative economic questions are based on judgments (opinions) and cannot be settled by appealing to the facts
The Pareto Criterion • In comparing two social states (state I and J) - state I is Pareto preferred to state J if no one is worse off in state I then in state J, and if at least one person is better off in state I than in state J.
Pareto Optimality • A social state is Pareto-optimal if no other attainable social state is Pareto-preferred to it. • Pareto-optimal is synonymous with economic efficiency.
Cost-Benefit Analysis • Net social benefits equals gross social benefits minus gross social costs. • In the move from social state I to social state J, if net social benefit is positive, then the cost-benefit criterion ranks J as preferred to I. • If net social benefit is negative, then the cost-benefit criterion ranks state I as preferred to state J.