Download
1 / 33
330 likes | 466 Views
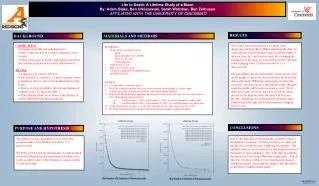
Muon Lifetime. Eric Chu & Joseph St. Marie. Goals of our Experience. Gain an understanding of electronics Design and run a working muon experiment Analyze data and improvement experiment Run final experiment Acquire data reading the lifetime of the muon to be close to 2.19 µs.

E N D
Muon Lifetime Eric Chu & Joseph St. Marie
Goals of our Experience • Gain an understanding of electronics • Design and run a working muon experiment • Analyze data and improvement experiment • Run final experiment • Acquire data reading the lifetime of the muon to be close to 2.19µs.
Understand the Electronics • How do we use the oscilloscope? • What is a scintillator? • How does the setup work?
Preparation • Conversion Graph
First Experiment • Started: June 25 at 16:00 • Ended: June 28 at 15:38
Errors • Thresholds not set • Scintillator D broken • Scintillator C not receiving ample voltage
What they Mean • Equation used is 1/c • 1st graph = 1/0.386 = 2.591μs • 2nd graph = 1/0.397 = 2.519μs
Final Experiment • Started: July 2 at 12:45 • Ended: July 6 at 9:20
Preparation • Coincidence graphs • Singles graphs • New power supply • Rearranging the setup
Singles Graph • To see what kind of particles are coming through (distinguish between noise and “real” particles) • Get a better understanding of how threshold affects counts
Coincidence Graphs • Final Threshold Levels: • Scintillator A: 120.026 mV • Scintillator B: 200.110 mV • Scintillator C: 70.601 mV
What they Mean • Equation used is 1/c • 1st graph = 1/0.567 = 1.764μs • 2nd graph = 1/0.655 = 1.527μs • 3rd graph = 1/0.462 = 2.165μs • 4th graph = 1/0.501 = 1.996μs
Errors • Different setup • Width • Faulty equipment • Different conversion at lower levels? • Or . . . Fireworks!!
El Fin (Spanish for “The End”)