Download
1 / 16
160 likes | 297 Views
The city of Pittsburgh, PA was a major steel producer in the first half of the twentieth century. However, like many major industrial American cities, the population of Pittsburgh has decreased since 1950. The table shows the population of Pittsburgh in various years.

E N D
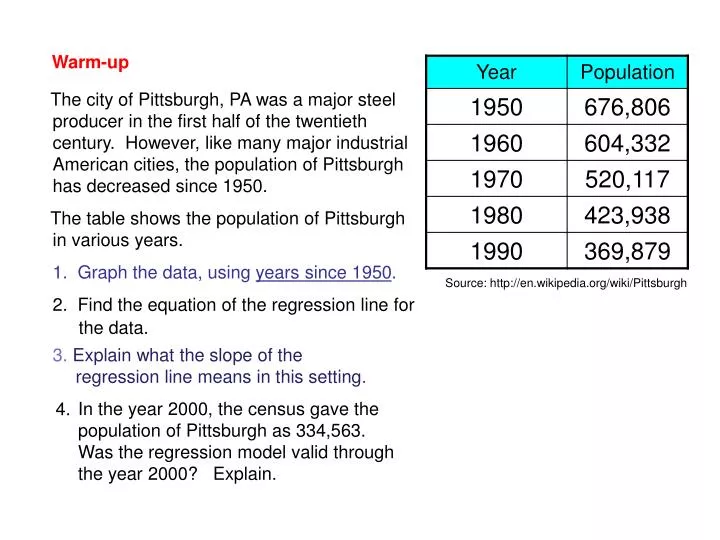
The city of Pittsburgh, PA was a major steel producer in the first half of the twentieth century. However, like many major industrial American cities, the population of Pittsburgh has decreased since 1950. The table shows the population of Pittsburgh in various years. 1. Graph the data, using years since 1950. 2. Find the equation of the regression line for 3. Explain what the slope of the ….regression line means in this setting. 4. the data. Warm-up Source: http://en.wikipedia.org/wiki/Pittsburgh In the year 2000, the census gave the population of Pittsburgh as 334,563. Was the regression model valid through the year 2000? Explain.
The city of Pittsburgh, PA was a major steel producer in the first half of the twentieth century. However, like many major industrial American cities, the population of Pittsburgh has decreased since 1950. The table shows the population of Pittsburgh in various years. 1. Graph the data, using years since 1950. 2. Find the equation of the regression line for 3. Explain what the slope of the ….….regression line means in this setting. 4. the data. Warm-up 0 10 20 30 40 Source: http://en.wikipedia.org/wiki/Pittsburgh Source: http://en.wikipedia.org/wiki/Pittsburgh y = -7942.48x + 677864 where x = years since 1950 and y = population It represents the average yearly decrease in population, approximately 7942 people. In the year 2000, the census gave the population of Pittsburgh as 334,563. Was the regression model valid through the year 2000? Explain. No, the model is not valid through the year 2000. The model’s estimate for the population of Pittsburgh in the year 2000 is 280,740, well below the actual 2000 Pittsburgh population.
MATH 1101 FINAL GROUP PROJECT Due – Last class before final exam (see syllabus) December 4 1. Work in groups of 3 or 4 people. More than four people in a group is not acceptable. Working alone is not acceptable 2. Work should not be done on the question paper. 3. Include a cover page with the names of group members. 4. Show all work neatly, clearly, and completely. Whenever appropriate, answer in full sentences. It is strongly recommended that group members carefully proofread each other’s solutions. 5. Several questions ask for graphs. All graphs should be imported from a computer and/or a graphing calculator. Include the viewing window or show the scale on the axes. 6. Put thought into your explanations. Do not hesitate to research them on the Web. Don’t take the easy way out! 7. Begin this group project as soon as possible and complete the problems gradually. For example, questions 1 – 8 deal with subject matter we have already covered in class and can be completed immediately. 8. Each group member must individually complete and turn in the form on the following page: “Assessment of Group Effectiveness.” These will be kept confidential. 9. This project is worth 60 points.
Assessment of Group Effectiveness Please rate your group on each of the following statements by circling the rating that applies. ( 1 = Strongly Disagree, 5 = Strongly Agree ) 1. The group functioned smoothly, with all members contributing equally. 1 2 3 4 5 Strongly disagree Strongly agree 2. Members of the group proofread each other’s work and gave appropriate input. 1 2 3 4 5 Strongly disagree Strongly agree 3. Group members met deadlines established by the group for completing work. 1 2 3 4 5 Strongly disagree Strongly agree 4. Group members were present for all group meetings. 1 2 3 4 5 Strongly disagree Strongly agree If any group member made little or no contribution to the group project, please indicate the name of that group member. This will be kept confidential. Names of the other group members: __________________________________ __________________________________ __________________________________ Your Name: ___________________________
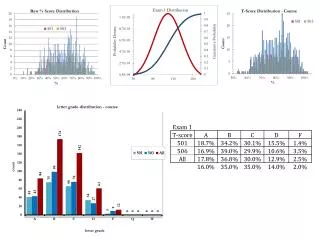
Answers to even-numbered HW problems Section 3.4 Ex 2a) P = .181t – 349.775 where t = years, P = enrollment in millions b) The slope means the enrollment increased, on average, by .181 million (181,000) students per year. c)P(2007) = 13.492 million (13,492,000) d) No. If the trend had been valid in 1993, the expected enrollment that year would have been 10.958 million, not 11.2 million. P =.181t + 12.406 using t = years since 2001
y 8 7 6 5 4 3 2 1 y = x – 5 x 1 2 3 4 5 6 7 8 9 • (2, -2) is the point where the two lines cross. 3x – 2y = 10 x + 2y = –2 is the solution to this system of two linear equations. This method of solution is called the “crossing graphs” method.
y = x – 5 3x – 2y = 10 x + 2y = –2 (2, -2) is the point where the two lines cross. is the solution to this system of two linear equations.
y = x – 5 3x – 2y = 10 x + 2y = –2 (2, -2) is the point where the two lines cross. is the solution to this system of two linear equations.
y –2y = 10 3x – 2 = 10 Substitution Method 3x – 2y = 10 x = – 2y – 2 x + 2y = –2 x + 2y = –2 x + 2(–2) = –2 (–2y – 2) –6y – 6 – 2y = 10 x = 2 –8y = 16 y = –2 Solution to the system: (2, -2)
y = 10 3x – 2 = 10 Substitution Method 3x – 2y = 10 x + 2y = –2 3x + x + 2 = 10 2 + 2y = –2 y = –2 x = 2 Solution to the system: (2, -2)
Because the coefficients of y in the two equations are opposites, adding the equations will eliminate the y-variable. 3x – 2y = 10 + x + 2y = -2 Elimination Method (Linear Combination) 3x – 2y = 10 x + 2y = -2 4x = 8 x = 2 2 + 2y = -2 y = -2 Solution to the system: (2, -2)
3(3x – 2y = 19) 3x – 2y = 19 7x + 3y = 6 9x – 6y = 57 + 14x + 6y = 12 2(7x + 3y = 6) 23x = 69 x = 3 3x – 2y = 19 3(3) – 2y = 19 –2y = 10 y = –5 (3, -5)
Practice Two systems of linear equations are given below. Solve one using the substitution method, and one using the elimination method. 3x – 5y = 47 8x + 3y = 11 2x + 3y = 7 5x – y = 9 (4, –7) (2, 1)
http://www.usg.edu/research/documents/enrollment_reports/rpt79-88.pdfhttp://www.usg.edu/research/documents/enrollment_reports/rpt79-88.pdf • Shown above are the enrollments at Kennesaw • State College and Valdosta State College at • the beginning of the school years listed. • Using years since 1980, Make scatter plots of the • enrollment data for both schools on the same • calculator screen. • Using linear regression models for both schools, and assuming the trends continued, identify the year in which the Kennesaw State’s enrollment • overtook Valdosta State’s enrollment.
Regression model for KSU y = 502.4x +3811.4 Regression model for VSU y = 344.1x + 4782.1 http://www.usg.edu/research/documents/enrollment_reports/rpt79-88.pdf • Shown above are the enrollments at Kennesaw • State College and Valdosta State College at • the beginning of the school years listed. • Using years since 1980, Make scatter plots of the • enrollment data for both schools on the same • calculator screen. • Using linear regression models for both schools, and assuming the trends continued, identify the year in which the Kennesaw State’s enrollment • overtook Valdosta State’s enrollment.
HOMEWORK Section 3.5: Do not read Section 3.5 Page 298 # S-11, S-12, S-16 Pages 299 – 300 # 5, 6, 10 X ALSODOWNLOAD, PRINT, AND COMPLETE THE PRACTICE TEST. DON’T FORGET TO DOWNLOAD AND PRINT A COPY OF THE FINAL GROUP PROJECT.

![[[ Wikipedia 101 ]]](https://cdn0.slideserve.com/4538/wikipedia-101-dt.jpg)