Download
1 / 18
180 likes | 186 Views
The Scientific Method:. the steps to follow to do an experiment. A flipbook of the inquiry process!. 1. IDENTIFY A PROBLEM. Write a scientific question! HAS to be answered by an experiment! CAN NOT be answered by “yes” or “no”! Two acceptable formats:

E N D
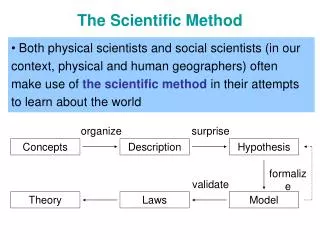
The Scientific Method: the steps to follow to do an experiment A flipbook of the inquiry process!
1. IDENTIFY A PROBLEM • Write a scientific question! • HAS to be answered by an experiment! • CAN NOT be answered by “yes” or “no”! • Two acceptable formats: • What is the effect of IV on DV? • How does IVaffect DV? • INDEPENDENT VARIABLE = the part the experimenter purposely changes! ONLY ONE! • DEPENDENT VARIABLE = the part the experimenter measures/records • CONTROL VARIABLES = all other factors that COULD affect an experiment that you MUST keep the same!
2. RESEARCH • Gather information on the topic • Specifically, look for background information about the VARIABLES! • Use a variety of sources • websites & online encyclopedias • Books • Interviews with an expert in the field • Magazines, etc. • Cite the sources properly • check with your language arts or science teacher! • Use a website such as citefast.com or bibme.org or easybib.com
3. WRITE A HYPOTHESIS • The “educated guess” • Educated because it is based on the research! • It is a prediction of what the results of the experiment will be • Must be a statement that can be tested! • ONE acceptable format: • If (insert information about what will be done to the IV), then(insert your prediction of what will happen to the DV) because(insert information about your research that helps you make the prediction).
THINK ABOUT IT…. • The prediction = YOUR CLAIM • The If ______then _________ part of your hypothesis! • The prediction must be educated= YOUR EVIDENCE • This is where your research comes into play! • The evidence must be relevant = YOUR REASONING • The because___________. part of your hypothesis Makes you think about your hypothesis a bit more, huh?
4.PLAN THE EXPERIMENT (Procedures) • List the DETAILED steps to follow • Include sizes, METRIC measurements, HOW to do each step….include pictures and analogies if necessary! • Make sure it is CONTROLLED • Has ONE independent variable • Has THREE levels of the IV • Has THREE trials • Create a materials list
5. CONDUCT EXPERIMENT & COLLECT OBSERVATIONS • NOW, follow the procedures! • Write down everything you see, notice, or measure in chart form (data table) • Include QUALITATIVE (parts you describe with your senses & words!) DATA • Include QUANTITATIVE (parts you measure, time, count, etc. that you record with numbers!) DATA • Be sure to include all the information from ITALK!!!! (Information, Titles, Axes locations, Labels, Key – when necessary)
Category Data Table Sample The effect of IV on DV (units)
Data Over Time Table Sample The effect of IV on DV (units)
6. ANALYZE DATA & OBSERVATIONS • Put the quantitative data into GRAPH form • LINE GRAPHS: used if you collect data over a period of time (Ex: plant growth for 7 days) • BAR GRAPHS: used if your data fits into categories (EX: types of snowboards that are faster)
6. ANALYZE DATA & OBSERVATIONS CONT. Consider the ITALK requirements: • Information – Does my chart/Graph contain the information I need to communicate? • Title- Does the title include information about BOTH variables (ex: The effect of ____on ___) and the unit of measurement? • Axis- Are they set up correctly? IV OR Time on X-Axis; DV on Y-Axis? • Labels- Are there labels on your Axis or charts to help you understand the data/observations? • Key- If your graph has included multiple trials or IV, have you included a key?
Category Data Graph Sample The Effect of IV on DV (measurement) Key: = Trial #1 = Trial #2 = Trial #3 Dependent Variable (measurement) Level 3 Level 2 Level 1 Independent Variable
Data over Time Graph Sample The effect of IV on DV (measurement) Key: = IV level #1 = IV level #2 = IV level #3 Dependent Variable (measurement) 1 3 5 7 10 13 15 Time (measurement: days? hours?)
6. ANALYZE DATA & OBSERVATIONS CONT.. • Create a RESULTS paragraph. Include: • What was learned from the tables & graphs? What does the graph represent? • What are some interesting features or trends in the data? Summarize it in words & explain any trends. • Is the hypothesis supported or denied? Why?
Sample Results Paragraph: The graphs represent the effect …..has on ….. The data shows that……. It is interesting to note that…… The trends discovered include….. The hypothesis was……. because…….
7. MAKE CONCLUSIONS • Summarize the WHOLE experiment in a QUALITY, 3rd person PARAGRAPH! Include: • Restate the problem (The problem in this experiment was “…?”.) • State the MAJOR findings of the experiment (what is the answer to the problem?) AND explain how the findings relate to the problem. (The major findings of the experiment included…. The connections between the findings and the problem are……) • Tell if the hypothesis was SUPPORTED or DENIED. Explain why. (The hypothesis was….because…..) • Rewrite a hypothesis based on the experimental results (Based on the results, the hypothesis should be, “if…, then…because…”. OR Based on the results, the hypothesis remains, “if…, then… because…”.)
7. MAKE CONCLUSIONS (cont.) • Compare the original (book) and experimental (lab) research. Explain similarities & differences. (The original research stated…..; however, in the experiment…. ORThe original research stated….. and the experimental research found the same.) • Explain sources of error. What went wrong? What affected the results? Tell HOW the errors affected the results. (Sources of error throughout the experiment include… These errors affected the results because….) • Make recommendations for future research. (Write a NEW problem to experiment with in order to get more information on the topic) (In the future, scientists should investigate the problem, “What is the effect of…. on….?” to learn more about this topic.) • Explain the impact on the scientific community (why would others care about what was learned?) (The scientific community is interested in the findings from this experiment because they….)
Sample conclusion: The problem in this experiment was“What is the effect of convection currents on movement of the earth’s plates?”. The major findings included that a current was created from the hotter area towards the cooler area and the plates moved with the current. The hypothesis was supported because it predicted that the plates would move along with the currents. Basedon the results, the hypothesis remains: “If convection currents occur in the asthenosphere below the lithospheric plates, then the plates will move in the direction of the current because of the current’s force.”. The original research stated that the plates above the convection currents are constantly in motion because of the currentsand the experimental research found the same. Sources of error throughout the experiment includethe air conditioning coming on and using too many “paper dots” creating too much weight for the currents. In the future, scientists should investigate the problem, “What is the effect of temperature differencesonthe speed of convection currents and plate movement?”to learn more about this topic. The scientific community is interested in the findings from this experiment because theycan predict the speed and direction of plate movement using data from the convection currents.