Download
1 / 28
320 likes | 531 Views
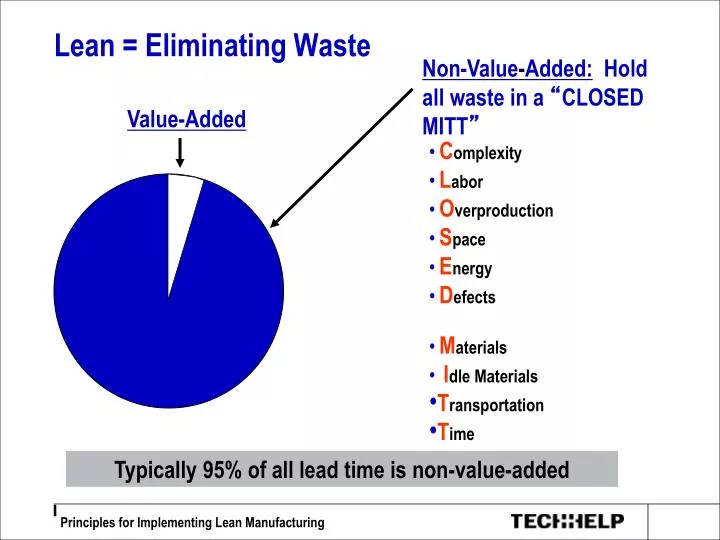
Lean = Eliminating Waste. Non-Value - Added: Hold all waste in a “ CLOSED MITT ”. Value-Added. C omplexity L abor O verproduction S pace E nergy D efects M aterials I dle Materials T ransportation T ime. Typically 95% of all lead time is non-value-added. Complexity.

E N D
Lean = Eliminating Waste Non-Value-Added: Hold all waste in a “CLOSED MITT” Value-Added • Complexity • Labor • Overproduction • Space • Energy • Defects • Materials • Idle Materials • Transportation • Time Typically 95% of all lead time is non-value-added
Complexity The waste of doing things the hard way! • Excessive paperwork • Excessive approvals • Redundancy • Poor communications Causes of complexity: • Multiple “patches” on the process w/o fixing the root cause. • The “cool” factor of technology or machinery. • Failing to look for the simple solutions.
Labor Waste • Human effort that adds no value to the product or service from the customers’ viewpoint. • Not using people’s mental, creative, and physical abilities • Causes of labor waste • Poor people/machine interface • Inconsistent work methods • Unfavorable workstation or cell layout • Doing unnecessary/unneeded operations • Poor workplace organization and housekeeping • Redundant inspections/approvals • Extra copies/excessive information
Overproduction The waste of making too much,too soon,too fast compared to the needs of the next process. • Causes of overproduction • Just-in-case logic • Misuse of automation • Long process setup • Non-level scheduling • Unbalanced workload • Misunderstood communications • Reward system • Unreliable shipment by suppliers
Space Waste • Using more space than is required to build the product to market demand. • Causes of wasted space • Poor layout • Too much inventory, especially work in process • Poor workplace organization • Excess equipment • Oversized equipment
Energy Waste • Using more energy (people and machine) than is required to build the product to market demand. • Causes of wasted energy • Oversized or poorly maintained equipment • Idle equipment • Poor workplace organization
Defects • Waste of inspection, repair and scrapping of material to which value has already been added. • Causes of defects • Weak process control • Poor quality system • Deficient planned maintenance • Inadequate education/training/work instructions • Product design • Customer needs not understood • Defective information
Materials Waste Any use of materials in excess of what is needed to create value. • Causes of material waste • Not understanding the costs • Inadequate education/training/work instructions • Lack of standards • Customer needs not understood
Idle Materials The waste of having materials “sitting around” in process without any value being added to them. • Causes of idle materials waste • Unbalanced workload • Unplanned maintenance • Long process setup times • Poor suppliers • Upstream quality problems • Unlevel scheduling
Transportation Waste • Transporting parts and materials around the plant, stacking and un-stacking, etc. • Causes of transportation waste • Poor plant layout • Poor understanding of production process flow • Large batch size, long lead times, large storage areas
Time Waste Any activity that consumes time without adding value, especially the waste of waiting (equipment downtime, waiting for materials, setup, etc.). • Causes of wasted time: • Poor machine maintenance. • Line imbalances. • Poor setup discipline. • Poor communication between processes.
Pull/Kanban Cellular/Flow TPM Quality at Source POUS Quick Changeover Standardized Work Batch Reduction Teams 5S System Visual Plant Layout Value Stream Mapping Lean Building Blocks KAIZEN
5S - Workplace Organization A safe, clean, neat, arrangement of the workplace provides a specific location for everything, and eliminates anything not required. In Lean manufacturing, we refer to this as 5S. Examples: EMT’s, fire department, etc.
Elements of a 5S Program • Sort—Perform “Sort Through and Sort Out,” - red tag all unneeded items and move them out to an established “quarantine” area for disposition within a predetermined time. “When in doubt, move it out!” • Set in Order—Identify the best location for remaining items and label them. “A place for everything & everything in its place”. • Sweep (Systematic Cleaning)—Clean everything, inside and out. Use visual sweeps to ensure everything is where it should be and that junk is not accumulating. • Standardize—Create the rules for maintaining and controlling the first 3 S’s. Use visual controls. • Sustain—Ensure adherence to the 5S standards through communication, training, self-discipline and rewards.
Visual Controls • Simple signals that provide an immediate understanding of a situation or condition. They are efficient, self-regulating, and worker-managed. • Examples: • Color-coded dies, tools, pallets • Lines on the floor to delineate storage areas, walkways, work areas etc. • Location signs on shop floor and in the office • Identification labels everywhere • Andon lights to indicate production status • Kanban (stock signal) Card
Standardized Work Graphic = Good • Tools are illustrated • Parts are pictured and • numbered • Spatial relationships • are clearly shown • Small items enlarged • to show assembly detail • All items are either • physically labeled or • identified by number in • assembly graphic
Visual Inspection Example • Specify what to inspect • Clear inspection criteria • Don’t overload operator with complex content or criteria • No missing screws • All screws seated