Download
1 / 39
400 likes | 648 Views
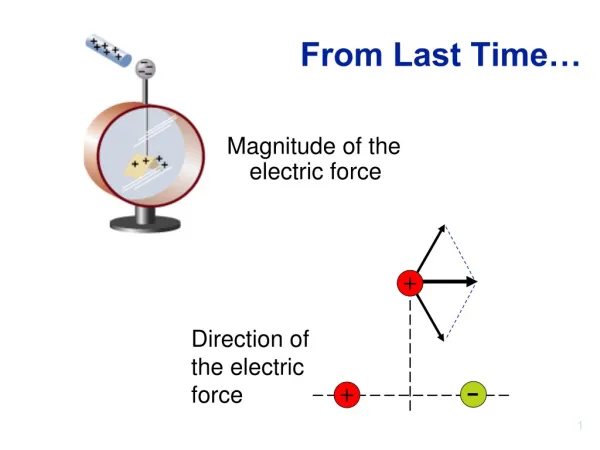
UTPS (Review from last time) . Urban Transportation Planning System Also known as the Four - Step Process A methodology to model traffic on a network Developed in 1962 (Chicago) Four Steps: Trip Generation Estimate Person Trips for each TAZ

E N D
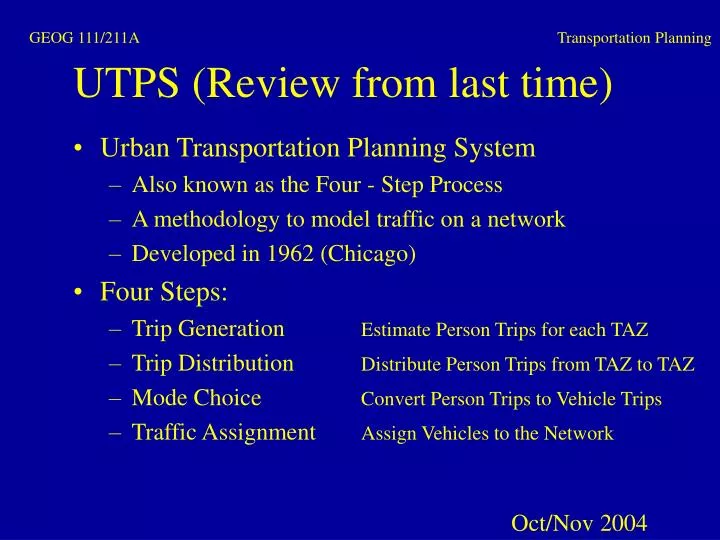
UTPS (Review from last time) • Urban Transportation Planning System • Also known as the Four - Step Process • A methodology to model traffic on a network • Developed in 1962 (Chicago) • Four Steps: • Trip Generation Estimate Person Trips for each TAZ • Trip Distribution Distribute Person Trips from TAZ to TAZ • Mode Choice Convert Person Trips to Vehicle Trips • Traffic Assignment Assign Vehicles to the Network Oct/Nov 2004
If no survey available? Survey Data – interviews of persons about their behavior Models of behavior – extract key aspects to capture most variation Discuss options in class! Use models – incorporate models into a computerized map
The Four Steps: • Trip Generation = Estimate Person Trips for each TAZ • Trip Distribution = Distribute Person Trips from TAZ to TAZ • Mode Choice = Convert Person Trips to Vehicle Trips • Traffic Assignment = Assign Vehicles to the Network • Pre 4-step = Land Use and Demographics? • Post 4-step = Emissions, Traffic Simulation, Link by Link Evaluation
Block Block Group Tract i.e., a city block Key Concepts of UTPS • TAZ: Traffic Analysis Zone • A TAZ is an arbitrary subdivision of the study area • TAZs are used in trip generation and trip distribution • TAZs may be any shape or size, but US Census Blocks, Block Groups, and Tracts are often used
Key Concepts of UTPS • Centroid • Every TAZ (Gate and Internal Zone) has a centroid, usually placed roughly at the geographic center of the TAZ • All trips to or from a TAZ are assumed to start or end at the centroid • Discussion • Why do we use TAZs and centroids to model trips?
Key Concepts of UTPS • Gate TAZs • TAZs placed outside the Study Area where major roads cross the boundaries of the study area • Used to model External Trips (i.e., trips with an origin or destination or both outside the study area) • Gate TAZs represent all areas outside of the study area Network Gate TAZ (Study Area)
Centroid Gate TAZ
Every zone is a node (the centroid) with an identifier and type
Trip Generation Additional suggested reading material: Ortuzar & Willumsen, third edition, Chapter 4.
Trip Generation Objectives • Estimate amount of trip making going out of a TAZ • Estimate amount of trip making going into a TAZ • Account for differences among TAZs due to person and household characteristics • Account for differences among TAZs due to business (establishments) characteristics • Develop functions to predict future amount of trip making
Trip Generation Usual Process • Collect Data, usually by Surveys and Census • Sociodemographic Data and Travel Behavior Data • Create Trip Generation Models • Estimate the number of Productions and Attractions for each TAZ, by Trip Purpose • Balance Productions and Attractions for each Trip Purpose • Total number of Productions and Attractions must be equal for each Trip Purpose
Trip Generation Models • Regression Models • Explanatory Variables are used to predict trip generation rates, usually by Multiple Regression • Trip Rate Analysis • Average trip generation rates are associated with different trip generators or land uses • Cross - Classification / Category Analysis • Average trip generation rates are associated with different trip generators or land uses as a function of generator or land use attributes • Models may be TAZ, Household, or Person - Based
Usual Unit of Analysis • TAZ - zonal rates (Number of trips as a function of a zone’s population characteristics) • Household rates (Number of trips as a function of household characteristics) • Person rates (Number of trips as a function of person characteristics) • NEW (PennState Research)! Multilevel rates (Number of trips as a function of person & household & TAZ characteristics)
Units and Models • TAZ-based models = productions and attractions converted to origins and destinations • Household and/or person - based models = origins and destinations • Establishment - based = attractions need to convert to destinations
Common Trip Definitions in CE422 • Trip: a one - way movement from one place to another • HB = Home Based: a trip where the home of the traveler is either the origin or the destination of the trip • HBW = Home Based Work: trips between home and work • HBNW = Home Based Non-Work: trips between home and shopping, also called HBS (Home Based Shopping) • HBO = Home Based Other: trips between home and a non - work / shopping location • NHB = Non Home Based: trips where neither end of the trip is the home of the traveler
Related Definitions 1+2+3=Tour or Trip Chain (home-based) 1.Home-based school trip Home School 2.NonHome-based work trip 3. Home-based work trip Work
= Origin = Destination Productions - Attractions All Home - Based Trips Production Attraction Residential Area Non-Residential Area Production Attraction Non - Home - Based Trips Production Attraction Non-Residential Area Non-Residential Area Attraction Production See also OW-p. 124
Trip Balancing Methods • Hold Productions Constant • Attractions are multiplied by the ratio of the sum of non-gate productions to the sum of non - gate attractions • Most common form of trip balancing • Hold Attractions Constant • Productions are multiplied by the ratio of the sum of non-gate productions to the sum of non - gate attractions • Hold Neither Productions or Attractions Constant • Not used very often Note: Gate Productions and Attractions are not included in this balancing process
Examples • http://tmip.fhwa.dot.gov/clearinghouse/docs/Time-Day/ - discussion of time-of-day issues • http://www.psrc.org/datapubs/index.htm (this is the metropolitan plan where models are used) • http://tmip.fhwa.dot.gov/clearinghouse/ <the ultimate web site for GEOG 111/211A> All sites verified October 2004
Gate Trip Estimation • Gate Trips Must be Modeled Separately • Gates have specific traffic volumes associated with them • Gates do not have sociodemographic data • Gates may represent trips with extremely variable trip lengths • Gate Trip Modeling • Correlate percentages of traffic volumes to different trip purposes (e.g., X% * Total daily volume observed = trips for commuting)
ITE Trip Generation Manual • Trip Rate Analysis Model • Univariate regression for trip generation • Primarily for businesses (attraction rates) • Explanatory variables are usually number of employees or square footage • Models developed using data from national averages and numerous studies from around the US Copies of the ITE Trip Generation Manual may be Found in the Hammond and PTI Libraries
TAZ Issues • Data availability limited by privacy issues • Larger TAZs, with complete data, are no longer necessarily homogeneous • Model accuracy decreases with larger TAZs TAZ Scale Modeling Accuracy Data Availability Block Good Poor Block Group Not Good Excellent Tract Poor Good
Model Formulation and Surveys • Privacy • May limit data collection efforts • Private information must remain secure • Response Rate • Good survey should have at least 85% response rate • Representative Sample Size • Pop. representation most important • Model Stability and Transferability • Over time, behavior may change • Behavior is not necessarily the same from place to place
Trip Generation Example • Similar to the lab exercise • From the Puget Sound Region in 1989 • Subsistence (work + school trips) • These are one way trips (origins) instead of productions
Sample Descriptives Class: What do you observe?
Class: Interpret the model Trip Generation Linear RegressionModel for Subsistence Trips
Let’s Improve the Model If (age < 20) Teen = 1 . If (age >= 20 and age < 35) Young=1. If (age >= 35 and age < 65) Midage=1. If (age >= 65 and age < 75) Senior=1. If (age >=75) VSenior=1.
Leisure Trip Generation The same model as for subsistence did not work!!!!!
Compare frequencies Class: Which one is easier to estimate?
Traditional Trip Generation • Input: social and economic characteristics • Output: productions/attractions, origins/destinations by zone • Key concepts: trip generation by purpose maybe more accurate but some purposes easier to predict (trips to work) • Other: Goods movement productions/attractions are handled in a similar way (Freight Forecasting Manual exists)
Post-MTC Lawsuit Models • Level of service = “quality” of transportation system measured in travel time from an origin to a destination • Trip generation also function of level of service • New models for induced demand = new demand for travel after improvements in level of service • Activity-based models to reflect “scheduling” of persons, coordination of activities • Multilevel models to reflect within group coordination
In the Lab - Check • TAZ population and productions • Businesses and attractions • What do you expect the relationship to be? • Does the relationship make sense?
Summary • Collect data using surveys • Derive a model using statistics • Use the model to predict number of trips generated in each zone • Apply this at each centroid representing a zone • Have all this ready for the next step – trip distribution If you cannot run a survey – use equations from ITE trip generation manual or other studies – check for similarities/verify results!