Download
1 / 28
280 likes | 287 Views
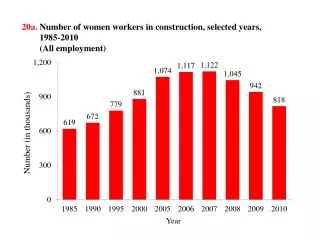
This report examines construction employment trends and the number of fatal falls and other fatalities in the United States from 2003 to 2017. It also explores the causes and rates of fatal falls in construction, as well as fatalities in specific construction subsectors and occupations.

E N D
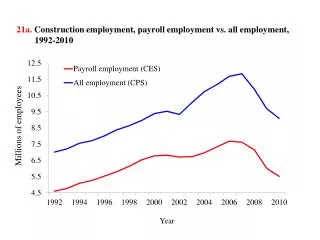
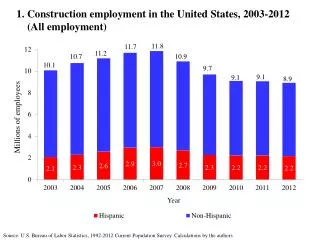
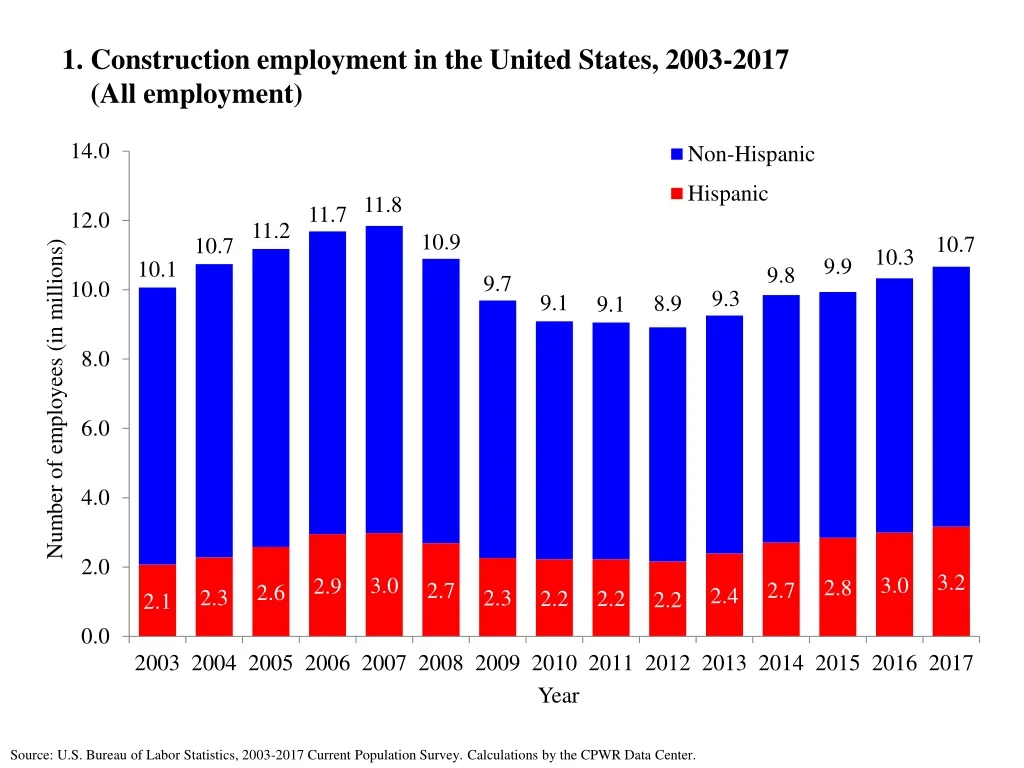
1. Construction employment in the United States, 2003-2017 (All employment) Source: U.S. Bureau of Labor Statistics, 2003-2017 Current Population Survey. Calculations by the CPWR Data Center.
2. Number of fatalities in construction, falls and other fatalities, 2003-2017 Note: In 2011, the CFOI switched to OIICS version 2.01 which categorizes slips, trips, and falls together. In previous years, slips and trips were categorized elsewhere. * Other fatalities are fatalities from all causes except falls. Source: Fatal injury data were generated by the CPWR Data Center with restricted access to the BLS CFOI micro data. The views expressed here do not necessarily reflect the views of the BLS.
3. Causes of fatalities in construction, 2011 and 2017 (All employment) Source: Fatal injury data were generated by the CPWR Data Center with restricted access to the BLS CFOI micro data. The views expressed here do not necessarily reflect the views of the BLS.
4. Number of fatal fall injuries to a lower level by major industry, 2017 (All employment) Source: Fatal injury data were generated by the CPWR Data Center with restricted access to the BLS CFOI micro data. The views expressed here do not necessarily reflect the views of the BLS.
5. Number and rate of fatal falls to a lower level in construction, 2003-2017 (All employment) Source: Fatal injury data were generated by the CPWR Data Center with restricted access to the BLS CFOI micro data. The views expressed here do not necessarily reflect the views of the BLS. Employment data were from the Current Population Survey. Calculations by the CPWR Data Center.
6. Fatal falls in construction, by height of fall, sum of 2015-2017 (All employment) Note: There were 139 deaths without height information that were excluded. Source: Fatal injury data were generated by the CPWR Data Center with restricted access to the BLS CFOI micro data. The views expressed here do not necessarily reflect the views of the BLS.
7. Fatal falls to a lower level in construction by primary source, sum of 2015-2017 (All employment) Source: Fatal injury data were generated by the CPWR Data Center with restricted access to the BLS CFOI micro data. The views expressed here do not necessarily reflect the views of the BLS.
8. Percentage of fatal falls to a lower level in construction by size of establishment, sum of 2015-2017 (private wage and salary workers) *145 fatalities without size of business information are excluded. Source: Fatal injury data were generated by the CPWR Data Center with restricted access to the BLS CFOI micro data. The views expressed here do not necessarily reflect the views of the BLS. Data on employees by establishment size from the Quarterly Census of Employment and Wages. Calculations by the CPWR Data Center.
9. Number of fatal falls, selected construction subsectors, sum of 2011-2017 (All employment) Source: Numbers were obtained from the BLS through special requests. Calculations by the authors. The views expressed here do not necessarily reflect the views of the BLS.
10. Number of fatal falls to a lower level, selected construction subsectors, 2011-2017 (All employment) Source: Fatal injury data were generated by the CPWR Data Center with restricted access to the BLS CFOI micro data. The views expressed here do not necessarily reflect the views of the BLS.
11. Number and rate of fatal falls to a lower level in construction, selected occupations, sum of 2015-2017 (All employment) Source: Fatal injury data were generated by the CPWR Data Center with restricted access to the BLS CFOI micro data. The views expressed here do not necessarily reflect the views of the BLS. Employment data were from the Current Population Survey. Calculations by the CPWR Data Center.
12. Number and rate of fatal falls to a lower level among roofers, 2011-2017 (All employment) Source: Fatal injury data were generated by the CPWR Data Center with restricted access to the BLS CFOI micro data. The views expressed here do not necessarily reflect the views of the BLS. Employment data were from the Current Population Survey. Calculations by the CPWR Data Center.
13. Number and rate of fatal falls to a lower level among laborers, 2011-2017 (All employment) Source: Fatal injury data were generated by the CPWR Data Center with restricted access to the BLS CFOI micro data. The views expressed here do not necessarily reflect the views of the BLS. Employment data were from the Current Population Survey. Calculations by the CPWR Data Center.
14. Number and rate of fatal falls to a lower level among carpenters, 2011-2017 (All employment) Source: Fatal injury data were generated by the CPWR Data Center with restricted access to the BLS CFOI micro data. The views expressed here do not necessarily reflect the views of the BLS. Employment data were from the Current Population Survey. Calculations by the CPWR Data Center.
15. Number and rate of fatal falls to a lower level among painters, 2011-2017 (All employment) Source: Fatal injury data were generated by the CPWR Data Center with restricted access to the BLS CFOI micro data. The views expressed here do not necessarily reflect the views of the BLS. Employment data were from the Current Population Survey. Calculations by the CPWR Data Center.
16. Number and rate of fatal falls to a lower level among ironworkers, 2011-2017 (all employment) Source: Fatal injury data were generated by the CPWR Data Center with restricted access to the BLS CFOI micro data. The views expressed here do not necessarily reflect the views of the BLS. Employment data were from the Current Population Survey. Calculations by the CPWR Data Center.
17. Number and rate of fatal falls to a lower level among electricians, 2011-2017 (all employment) Source: Fatal injury data were generated by the CPWR Data Center with restricted access to the BLS CFOI micro data. The views expressed here do not necessarily reflect the views of the BLS. Employment data were from the Current Population Survey. Calculations by the CPWR Data Center.
18. Number of fatal falls to a lower level in construction, Hispanic versus non-Hispanic, 2011-2017 (All employment) Source: Fatal injury data were generated by the CPWR Data Center with restricted access to the BLS CFOI micro data. The views expressed here do not necessarily reflect the views of the BLS.
19. Rate of fatal falls to a lower level, Hispanic versus white, non-Hispanic, 2011-2017 (All employment) Source: Fatal injury data were generated by the CPWR Data Center with restricted access to the BLS CFOI micro data. The views expressed here do not necessarily reflect the views of the BLS. Employment data were from the Current Population Survey. Calculations by the CPWR Data Center.
20. Rate of fatal falls to a lower level in construction, selected characteristics, average of 2015-2017 (All employment) Source: Fatal injury data were generated by the CPWR Data Center with restricted access to the BLS CFOI micro data. The views expressed here do not necessarily reflect the views of the BLS. Employment data were from the Current Population Survey. Calculations by the CPWR Data Center.
21. Percentage and rate of fatal falls in construction, by age group, average of 2015-2017 (All employment) Source: Fatal injury data were generated by the CPWR Data Center with restricted access to the BLS CFOI micro data. The views expressed here do not necessarily reflect the views of the BLS. Employment data were from the Current Population Survey. Calculations by the CPWR Data Center.
22. Fatal falls in construction, same level versus lower level by age group, sum of 2011-2017 (all employment) Source: Fatal injury data were generated by the CPWR Data Center with restricted access to the BLS CFOI micro data. The views expressed here do not necessarily reflect the views of the BLS.
23. Primary source of fatal falls in construction, by age group, sum of 2015-2017 (All employment) Source: Fatal injury data were generated by the CPWR Data Center with restricted access to the BLS CFOI micro data. The views expressed here do not necessarily reflect the views of the BLS.
24. Number and rate of fall injuries resulting in days away from work in construction, 2003-2017 Revised OIICS Note: In 2011, the SOII switched to OIICS version 2.01 which categorizes slips, trips, and falls together. In previous years, slips and trips were categorized elsewhere. Data cover private wage-and-salary workers. Source: 2003-2017 Survey of Occupational Injuries and Illnesses.
25. Number of nonfatal fall injuries by major industry, 2017 Source: U.S. Bureau of Labor Statistics, 2017 Survey of Occupational Injuries and Illnesses.
26. Number and rate of nonfatal injuries from falls resulting in days away from work, selected construction occupations, 2017 (Private wage-and-salary workers) Note: Falls include injuries from slips and trips. Source: Number of nonfatal injuries are unpublished estimates from the U.S. Bureau of Labor Statistics (BLS), Survey of Occupational Injuries and Illnesses, and were obtained from the BLS through special requests. Numbers of FTEs were estimated using the Current Population Survey. Calculations by the CPWR Data Center.
27. Number of individuals being reached through the Campaign, by major partner category 2,626,526 individuals Academic, Government & Research 222,300 individuals Contractors & Associations 208,500 individuals Unions 112,000 individuals Manufacturers 33,500 individuals Safety Agencies & Insurance Note: Counts exclude the lead organizations.
28. Impact of the Campaign in the construction industry and beyond 75%noticed an increase in fall prevention activitiesat their organization or in the industry (n=59) 72% noticed improvements in overall safety and health initiatives with topics other than falls at their organization or in the industry (n=60)