Download
1 / 14
150 likes | 309 Views
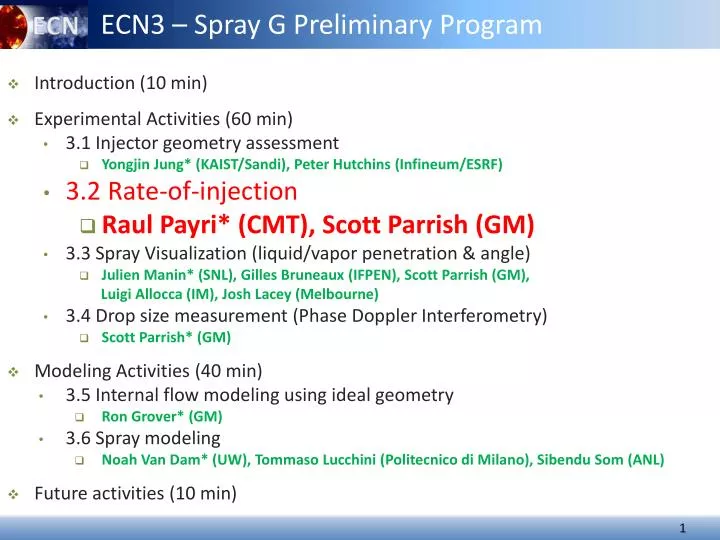
ECN3 – Spray G Preliminary Program. Introduction (10 min) Experimental Activities (60 min) 3.1 Injector geometry assessment Yongjin Jung* ( KAIST /Sandi ), Peter Hutchins ( Infineum / ESRF ) 3.2 Rate-of-injection Raul Payri* (CMT ), Scott Parrish (GM )

E N D
ECN3 – Spray G Preliminary Program • Introduction (10 min) • Experimental Activities (60 min) • 3.1 Injector geometry assessment • YongjinJung* (KAIST/Sandi), Peter Hutchins (Infineum/ESRF) • 3.2 Rate-of-injection • Raul Payri* (CMT), Scott Parrish (GM) • 3.3 Spray Visualization (liquid/vapor penetration & angle) • Julien Manin* (SNL), Gilles Bruneaux(IFPEN), Scott Parrish (GM), • Luigi Allocca (IM), Josh Lacey (Melbourne) • 3.4 Drop size measurement (Phase Doppler Interferometry) • Scott Parrish* (GM) • Modeling Activities (40 min) • 3.5 Internal flow modeling using ideal geometry • Ron Grover* (GM) • 3.6 Spray modeling • Noah Van Dam* (UW), Tommaso Lucchini (Politecnico di Milano), Sibendu Som (ANL) • Future activities (10 min) • *Discussion Leader
Spray G – Rate of Injection • Gasoline Spray (Spray G) • Topic 3.2Rate-of-injection • Raul Payri* (CMT) • Scott Parrish (GM)
Spray G – Injection Rate • Control of commandsignalswithDelphidriver + pulse generator. • Injectorbodytemperature control. CMT Setup GM Setup Fuel is accumulated in a big volume System for injector temperature control
Spray G – Injection Rate (CMT) • Methodology • Experimental instruments • A commercial EVI-IAV system (Bosch method) is used. • Pressure regulated in the rail. • Additional pressure is measured in the rail with a Kistler sensor • Control of command signals of the injector with driver + pulse generator. • Outputs • Injection rate shape. • Total amount of fuel injected.
Spray G – Injection Rate (CMT) Mass-flow meter output signal Injection rate [g/s] 50 injections ΔPEVI[bar] At: EVI mass flow meter a: speed of sound f(p,T) Time [s] Averaged injected mass - EVI Injection rate [g/s] comparison with Mass measured with a gravimetric scale Time [s]
Spray G – Injection Rate • Shot to shot dispersion on GM injector 28 • Similar results obtained for all injectors in GM or CMT Injector 28, Spray G Conditions – Iso-Octane, 20 MPa, 90C, 680 µs, 6 bar column pressure. Rate Meter: IAV (rate tube method) ≈ 310 µs ≈ 780 µs
Spray G – Injection Rate (CMT) • Nominal point comparison
Spray G – Injection Rate (CMT) • Rail pressure Influence for injector #26
Spray G – Injection Rate (CMT) • Back pressure Influence for injector #26 • Small variations in BP affect injection dynamics but barely change the total injected mass. • A high BP “smoothes” the opening and closing of the injector.
Spray G – Injection Rate (CMT) • Frequency Influence on injection rate At 1Hz (red signal) the injector closes sooner for any ET.
Spray G – Injection Rate (CMT) • Frequency Influence CMT vs GM Injector 16 GM Injector 26 CMT
Spray G – Injection Rate (CMT) • CMT Measurement comparison – Energizing time Mass flow curves at different ET overlap Robust operation
Spray G – Injection Rate (Conclusions) • Use of Delphi ECU to assure equal electrical signals in all research participant groups • Injector temperature control is important • Spray “G” injectors perform very well in terms of shot to shot dispersion (all units) • Similar injected quantities for the different injectors, it will be possible to adjust slightly the ET to inject 10 mg in all the cases if it is necessary • Known influence of injection pressure or Energizing Time • Back pressure affects the dynamics of the injector (specially at 20 bar) • Small effect of injection frequency on injection rate • Probably this effect is due to thermal issues in the injector • Very difficult to properly measure 1Hz injection frequency with a gravimetric balance due to the small injected quantity
Spray G – Injection Rate (Future work) • CMT will construct a test rig to measure spray momentum for Spray “G” injector • Compare injection rate derived from spray momentum and measured with injection rate • Periodic check of injection rate after extensive campaigns are performed in high pressure and high temperature vessels • Understand differences in injected quantities between different injector samples (when differences are the order of more than 5%) • Determination of a different energizing time for each injector so that exactly 10 mg/st could be injected • Possible generation of a virtual injector “clean signal” so that modelers could use it