Download
1 / 19
190 likes | 308 Views
Lecture 10: TCP Performance. ITCS 6166/8166 091 Spring 2007 Jamie Payton Department of Computer Science University of North Carolina at Charlotte February 12, 2007. Slides adapted from: Congestion slides for Computer Networks: A Systems Approach (Peterson and Davis)

E N D
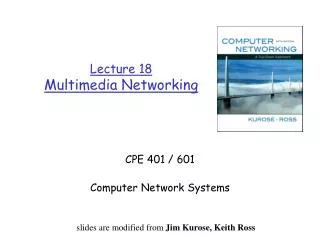
Lecture 10: TCP Performance ITCS 6166/8166 091 Spring 2007 Jamie Payton Department of Computer Science University of North Carolina at Charlotte February 12, 2007 Slides adapted from: Congestion slides for Computer Networks: A Systems Approach (Peterson and Davis) Chapter 3 slides for Computer Networking: A Top Down Approach Featuring the Internet (Kurose and Ross)
Announcements • Homework 1 deadline is extended • Due: Feb. 16 at 5 pm • Submit through WebCT • Homework 2 • Assigned: Feb. 14 • Due: Feb. 21
Transmission Control Protocol • Implementation of sliding window protocol TCP uses sliding windows at sender and receiver (buffers) TCP Segment (Packet) Structure
TCP Flavors • TCP Tahoe • Slow start • Switch to AIMD when hit threshold • Handling loss • Unconditional reduction of window to 1 MSS • TCP Reno • Slow start • Switch to AIMD when hit threshold • Handling loss • Reduction of window to ½ when triple duplicate ACKS • “Fast recovery”: skip slow start, go to threshold
TCP Performance • What is the average throughput for a connection? • Let W be the window size at which loss occurs • Maximum rate is W/RTT • “Minimum” rate (Reno) is W/(2*RTT) • Average rate is 0.75*W/RTT • More detailed formula • Average throughput is 1.22*MSS/(RTT*√L)
Fairness goal: if K TCP sessions share same bottleneck link of bandwidth R, each should have average rate of R/K TCP connection 1 bottleneck router capacity R TCP connection 2 TCP Fairness
Two competing sessions: Additive increase gives slope of 1, as throughout increases Multiplicative decrease decreases throughput proportionally Why is TCP Fair? equal bandwidth share R loss: decrease window by factor of 2 congestion avoidance: additive increase Connection 2 throughput loss: decrease window by factor of 2 congestion avoidance: additive increase Connection 1 throughput R
Fairness and UDP Multimedia applications often use UDP can pump audio/video at constant rate rate will not be throttled by congestion control packet loss can be tolerated Research area: making UDP play nice with TCP Fairness and TCP Applications may use parallel connections Web browsers do this Example: link of rate R currently supporting 9 connections; new app asks for 1 TCP Rate? new app asks for 11 TCPs Rate? More on Fairness
Q:How long does it take to receive an object from a Web server after sending a request? Ignoring congestion, delay is influenced by: TCP connection establishment data transmission delay slow start Notation, assumptions: Assume one link between client and server of rate R S: MSS (bits) O: object size (bits) no retransmissions (no loss, no corruption) Window size: First assume: fixed congestion window, W segments Then dynamic window, modeling slow start Delay Modeling
First case: WS/R > RTT + S/R: ACK for first segment in window returns before window’s worth of data sent Fixed Congestion Window (1) delay = 2RTT + O/R
Second case: WS/R < RTT + S/R: wait for ACK after sending window’s worth of data sent Fixed Congestion Window (2) delay = 2RTT + O/R + (K-1)[S/R + RTT - WS/R]
TCP Delay Modeling: Slow Start (1) Suppose use of slow start Will show that the delay for one object is: where P is the number of times TCP idles at server: - where Q is the number of times the server idles if the object were of infinite size. - and K is the number of windows that cover the object.
TCP Delay Modeling: Slow Start (2) • Delay components: • 2 RTT for connection estab and request • O/R to transmit object • time server idles due to slow start • Server idles: P =min{K-1,Q} times • Example: • O/S = 15 segments • K = 4 windows • Q = 2 • P = min{K-1,Q} = 2 • Server idles P=2 times
TCP Delay Modeling (4) Recall K = number of windows that cover object How do we calculate K ? Calculation of Q, number of idles for infinite-size object, is similar (see HW).
HTTP Modeling • Assume Web page consists of: • 1 base HTML page (of size O bits) • M images (each of size O bits) • Non-persistent HTTP: • M+1 TCP connections in series • Response time = (M+1)O/R + (M+1)2RTT + sum of idle times • Persistent HTTP: • 2 RTT to request and receive base HTML file • 1 RTT to request and receive M images • Response time = (M+1)O/R + 3RTT + sum of idle times • Non-persistent HTTP with X parallel connections • Suppose M/X integer. • 1 TCP connection for base file • M/X sets of parallel connections for images. • Response time = (M+1)O/R + (M/X + 1)2RTT + sum of idle times
HTTP Response time (in seconds) RTT = 100 msec, O = 5 Kbytes, M=10 and X=5 For low bandwidth, connection & response time dominated by transmission time. Persistent connections only give minor improvement over parallel connections.
HTTP Response time (in seconds) RTT =1 sec, O = 5 Kbytes, M=10 and X=5 For larger RTT, response time dominated by TCP establishment & slow start delays. Persistent connections now give important improvement: particularly in high delaybandwidth networks.