Download
1 / 15
460 likes | 1.07k Views
2011 Clustering in Machine Learning. Topic 7: K-Means, Mixtures of Gaussian and EM Brief Introduction to Clustering Eick/Alpaydin transparencies on clustering A little more on EM Topic 9: Density-based clustering. Motivation: Why Clustering?.

E N D
2011 Clustering in Machine Learning • Topic 7: K-Means, Mixtures of Gaussian and EM • Brief Introduction to Clustering • Eick/Alpaydin transparencies on clustering • A little more on EM • Topic 9: Density-based clustering
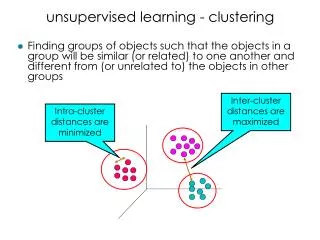
Motivation: Why Clustering? Problem: Identify (a small number of) groups of similar objects in a given (large) set of object. Goals: • Find representatives for homogeneous groups Data Compression • Find “natural” clusters and describe their properties ”natural” Data Types • Find suitable and useful grouping ”useful” Data Classes • Find unusual data object Outlier Detection
Examples of Clustering Applications • Plant/Animal Classification • Book Ordering • Cloth Sizes • Fraud Detection (Find outlier)
Major Clustering Approaches • Partitioning algorithms/Representative-based/Prototype-based Clustering Algorithm: Construct and search various partitions and then evaluate them by some criterion or fitness function Kmeans • Hierarchical algorithms: Create a hierarchical decomposition of the set of data (or objects) using some criterion • Density-based: based on connectivity and density functions DBSCAN, DENCLUE,… • Grid-based: based on a multiple-level granularity structure • Graph-based: constructs a graph and then clusters the graph SNN • Model-based: A model is hypothesized for each of the clusters and the idea is to find the best fit of that model to each other EM
Representative-Based Clustering • Aims at finding a set of objects among all objects (called representatives) in the data set that best represent the objects in the data set. Each representative corresponds to a cluster. • The remaining objects in the data set are then clustered around these representatives by assigning objects to the cluster of the closest representative. Remarks: • The popular k-medoid algorithm, also called PAM, is a representative-based clustering algorithm; K-means also shares the characteristics of representative-based clustering, except that the representatives used by k-means not necessarily have to belong to the data set. • If the representative do not need to belong to the dataset we call the algorithms prototype-based clustering. K-means is a prototype-based clustering algorithm
Representative-Based Clustering … (Continued) 2 Attribute1 1 3 Attribute2 4
Representative-Based Supervised Clustering … (continued) 2 Attribute1 1 3 Attribute2 4 Objective of RSC: Find a subset OR of O such that the clustering X obtained by using the objects in OR as representatives minimizes q(X); q is an objective/fitness function.
The K-Means Clustering Method • Given k, the k-means algorithm is implemented in 4 steps: • Partition objects into k nonempty subsets • Compute seed points as the centroids of the clusters of the current partition. The centroid is the center (mean point) of the cluster. • Assign each object to the cluster with the nearest seed point. • Go back to Step 2, stop when no more new assignment.
The K-Means Clustering Method Cluster”New” Model • Example Model”New” Cluster
Comments on K-Means Strength • Relatively efficient: O(t*k*n*d), where n is # objects, k is # clusters, and t is # iterations, d is the # dimensions. Usually, d, k, t << n; in this case, K-Mean’s runtime is O(n). • Storage only O(n)—in contrast to other representative-based algorithms, only computes distances between centroids and objects in the dataset, and not between objects in the dataset; therefore, the distance matrix does not need to be stored. • Easy to use; well studied; we know what to expect • Finds local optimum of the SSE fitness function. The global optimum may be found using techniques such as: deterministic annealing and genetic algorithms • Implicitly uses a fitness function (finds a local minimum for SSE see later) --- does not waste time computing fitness values Weakness • Applicable only when mean is defined --- what about categorical data? • Need to specify k, the number of clusters, in advance • Sensitive to outliers • Not suitable to discover clusters with non-convex shapes • Sensitive to initialization; bad initialization might lead to bad results.
Complication: Empty Clusters K=3 X X X X X X X X X X We assume that the k-means initialization assigns the green, blue, and brown points to a single cluster; after centroids are computed and objects are reassigned, it can easily be seen that that the brown cluster becomes empty.
Convex Shape Cluster • Convex Shape: if we take two points belonging to a cluster then all the points on a direct line connecting these two points must also in the cluster. • Shape of K-means/K-mediods clusters are convex polygons Convex Shape. • Shapes of clusters of a representative-based clustering algorithm can be computed as a Voronoi diagram for the set of cluster representatives. • Voronoi cells are always convex, but there are convex shapes that a different from those of Voronoi cells.
Voronoi Diagram for a Representative-based Clustering Each cell contains one representatives, and every location within the cell is closer to that sample than to any other sample. A Voronoi diagram divides the space into such cells. Voronoi cells define cluster boundary! Cluster Representative (e.g. medoid/centroid)
EM — Expectation Maximization • EM — A popular iterative refinement algorithm • Uses k-Gaussians; one for each cluster • An extension to k-means • Assign each object to a cluster according to a weight (prob. distribution) • New means/covariances are computed based on weighted measures • General idea • Starts with an initial estimate of the parameter vector • Iteratively rescores the patterns against the mixture density produced by the parameter vector • The rescored patterns are used to update the parameter updates • Patterns belonging to the same cluster, if they are placed by their scores in a particular component • Algorithm converges fast but may not be in global optima
The EM (Expectation Maximization) Algorithm • Initially, randomly assign k cluster centers • Iteratively refine the clusters based on two steps • Expectation step: assign each data point Xi to cluster Ci with the following probability • Maximization step: • Estimation of model parameters