Download

1 / 19
190 likes | 202 Views
Multi-Core Programming Assignment. Dongrui She December 9, 2010. Goal of the Assignment. The purpose of this assignment is to Have in-depth understanding of the architectures of real-world multi-core CPUs

E N D
Multi-Core Programming Assignment Dongrui She December 9, 2010
Goal of the Assignment The purpose of this assignment is to • Have in-depth understanding of the architectures of real-world multi-core CPUs • Learn about how to develop parallel applications on such architectures, and how to analyze the performance in a real environment
Outline • Parallelism in Mainstream CPUs • Exploiting Parallelism in CPUs • Methods to analyze application performance • Introduction to VTune • Example: Matrix Multiplication
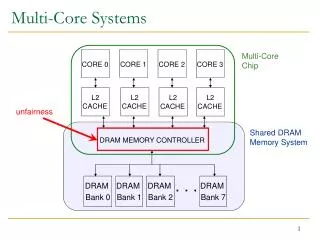
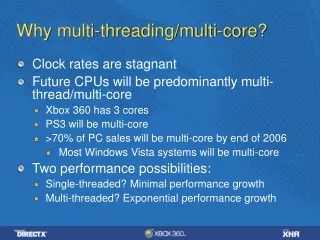
Parallelism in Typical Mainstream CPUs • 1-12 cores with shared memory • Large on-chip cache • Both private and shared cache • Inside a core: • ILP: 3-4 issue out-of-order superscalar core • DLP: 128-bit SIMD instructions (SSE) • TLP: 2-way SMT (Intel’s hyper-threading) • Typical core frequency: 2-3 GHz
Ways to Exploit Parallelism • ILP: cannot be controlled directly • Compiler optimization and proper coding style can help • TLP and multi-core: multi-threaded programming • Logically they are the same for the OS • Many programming models available, e.g., OpenMP, Cilk, pthread. • We will introduce OpenMP in more detail latter
Exploiting DLP • Two ways to do vectorization • Auto-vectorization by compilers • The Intel compiler is considered the best • Most compilers are limited to (simple) inner-most loops • Pragmas can be use to tell compilers more information to enable more aggressive optimization • Intrinsics or inline assembly • Vectorization by programmers, more information about app. • Examples / Documentation will be on the assignment website • Two most common obstacle • Cross-iteration dependency • Alignment issues
Vectorization Example – FIR • Basic idea to vectorize a loop: unroll and pack multiple scalar iterations into one vector iteration • Inner-most loop is an obvious choice, but • Packing and unpack can be costly, especially if the trip count is not aligned with the machine vector length • Inner loops may have low trip count for(i=0; i< N; i++){ s = 0; for(j=0; j < 4; j ++) s += x[i+j] * c[j] y[i] = s } vc[0:3] = {c[0], c[1], c[2], c[3]} for (i=0; i< N; i++){ vs[0:3] = x[i:i+3] * vc y[i] = sum(vs[0:3]) }
Vectorization Example – FIR (2) • Outer-loop vectorization can be more efficient • However, most compiler cannot do it for (i=0; i< N; i+=4){ vs[0:3] = {0, 0, 0, 0} for (j =0; j < 4; j ++) { vc[0:3] = vsplat(c[j]) vs[0:3] += x[i+j:i+j+3] * vc } y[i:i+3] = vs[0:3] } for(i=0; i<N; i++){ s = 0; for(j=0; j<4; j++) s += x[i+j] * c[j] y[i] = s }
Analyzing Application Performance • Understand and optimize application performance • Is the performance good or bad? • Which part should run in parallel? • Where to optimize? • Static analysis and execution time measurement are not enough • They are not enough to understand the dynamic behavior of complex applications • We need profiling
Ways to Profile an Application • Emulation/Simulation • Accurate (if the model is accurate enough) but slow • Intrusive profilers: • The profiling codes may change the program (timing) behavior • Statistical profilers: • Periodically halt the program and sample the PC and other data. Less overhead and better overall accuracy • Most commonly used profilers are based on this approach, e.g., Intel VTune, AMD CodeAnalyst.
Profiling with Intel VTune • Features • Based on sampling • Supports event counters in the PMU (Performance Monitoring Unit) of Intel CPUs • Requirements • Intel CPUs (Core or newer) running Linux or Windows • Program compiled with debug symbols (-g) • Alternatives • For AMD CPUs: AMD CodeAnalyst is similar to VTune • Open source solution for Linux: pfmon • May require some effort to get it running
VTune User Interface • Information of each function Total number of cycles (for main); Note: these are statistical values Cycles per instruction ratio(for main); Note: these are derived values Distribution of events over time Choose event to show in the distribution diagram
VTune Detailed View Shaded lines are corresponding disassembly of the selected line in the original source Counter values
Example: Matrix Multiplication • Straightforward implementation A = (double *)malloc(N*P*sizeof(double)); B = (double *)malloc(P*M*sizeof(double)); C = (double *)malloc(N*M*sizeof(double)); ... // Initialize A, B and C for (i=0; i < N; i++){ for (j=0; j < M; j++){ for(k=0; k <P; k++){ *(C+(i*N+j))+= *(A+(i*N+k)) * *(B+(k*P+j)); } } } 1024x1024 matrices. Program compiled with optimization off (-O0), performance on a Core 2 Quad 8300 with 32bit Linux: Number of operations is 2*N*N*N Order 1024 multiplication in 58.7 seconds Order 1024 multiplication at 36.6 mflops
Initial Profiling Result • CPI is very high, and LLC miss is an obvious problem • The inner-most loop is causing a lot of cache misses This line is the hotspot
Analyze the Problem • Access pattern of B is the problem A = (double *)malloc(N*P*sizeof(double)); B = (double *)malloc(P*M*sizeof(double)); C = (double *)malloc(N*M*sizeof(double)); ... // Initialize A, B and C for (i=0; i < N; i++){ for(k=0; k <P; k++){ for (j=0; j < M; j++){ *(C+(i*N+j))+= *(A+(i*N+k)) * *(B+(k*P+j)); } } } A = (double *)malloc(N*P*sizeof(double)); B = (double *)malloc(P*M*sizeof(double)); C = (double *)malloc(N*M*sizeof(double)); ... // Initialize A, B and C for (i=0; i < N; i++){ for (j=0; j < M; j++){ for(k=0; k <P; k++){ *(C+(i*N+j))+= *(A+(i*N+k)) * *(B+(k*P+j)); } } } Just inter-change the loops Access to B is not contiguous as B is stored in row-major order ~5.7x speed-up by a minor change ! Order 1024 multiplication in 10.315131 seconds Order 1024 multiplication at 208.187717 mflops
Profiling Result After Optimization In this case, compilers should be able to interchange the loop automatically (in our experiment, ICC can, but GCC cannot). But further optimizations like tiling still need to be done by hand. Use -fast in ICC and you get: Order 1024 multiplication in 0.507935 seconds Order 1024 multiplication at 4227.870591 mflops
Assignment Setup • Platform: a PC with multi-core CPU • TU/e Notebook 2009 and 2010 are OK • Software: Intel compiler and VTune Profiler • Available on both Windows and Linux • A 30-day evaluation license can be obtained from the web-site for free • For linux, a 1-year non-commercial license is available • Assignment can be done in team of two students • Make sure at least one has the proper platform
Some General Remarks • Both GCC and ICC have options to report whether the loops are vectorized and if not what’s the reason. It can be quite helpful • ICC’s optimization tends to be quite aggressive, but it doesn’t always payoff. So check the manual and use the proper flags and pragmas • Bear in mind that VTune is based on sampling. So the numbers are NOT exact