Download
1 / 1
10 likes | 93 Views
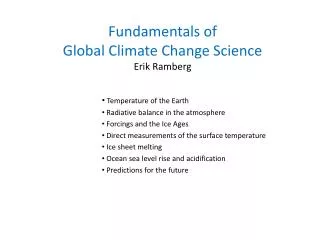
Methods for Using GIS to Determine Impact of Climate Change on NH’s Transportation Network Michelle McMillan 1 , Dr. Jo Sias Daniel 2 , Dr. Jennifer Jacobs 2 1 RETE Participant, Sanborn Regional Middle School 2 Civil Engineering Department, University of New Hampshire. Introduction:

E N D
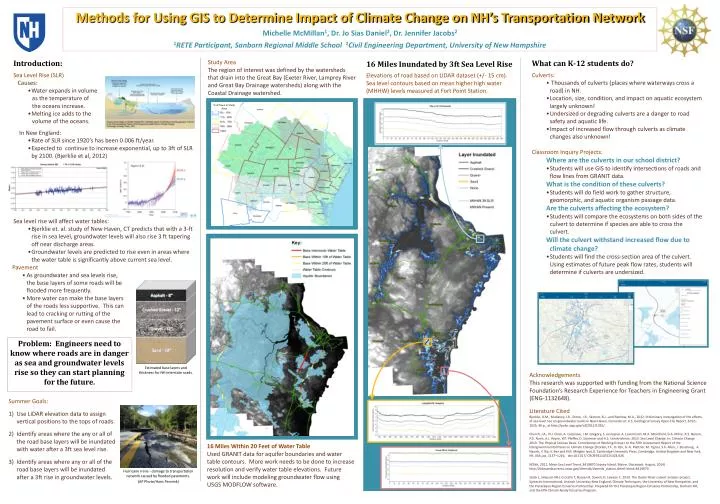
Methods for Using GIS to Determine Impact of Climate Change on NH’s Transportation Network Michelle McMillan1,Dr. Jo Sias Daniel2, Dr. Jennifer Jacobs2 1RETE Participant, Sanborn Regional Middle School 2Civil Engineering Department, University of New Hampshire • Introduction: • Sea Level Rise (SLR) • Causes: • Water expands in volume • as the temperature of • the oceans increase. • Melting ice adds to the • volume of the oceans. • In New England: • Rate of SLR since 1920’s has been 0.006 ft/year. • Expected to continue to increase exponential, up to 3ft of SLR by 2100. (Bjerklie et al, 2012) • Sea level rise will affect water tables: • Bjerklie et. al. study of New Haven, CT predicts that with a 3-ft rise in sea level, groundwater levels will also rise 3 ft tapering off near discharge areas. • Groundwater levels are predicted to rise even in areas where the water table is significantly above current sea level. Study Area The region of interest was defined by the watersheds that drain into the Great Bay (Exeter River, Lamprey River and Great Bay Drainage watersheds) along with the Coastal Drainage watershed. 16 Miles Inundated by 3ft Sea Level Rise Elevations of road based on LIDAR dataset (+/- 15 cm). Sea level contours based on mean higher high water (MHHW) levels measured at Fort Point Station. • What can K-12 students do? • Culverts: • Thousands of culverts (places where waterways cross a road) in NH. • Location, size, condition, and impact on aquatic ecosystem largely unknown! • Undersized or degrading culverts are a danger to road safety and aquatic life. • Impact of increased flow through culverts as climate changes also unknown! • Classroom Inquiry Projects: • Where are the culverts in our school district? • Students will use GIS to identify intersections of roads and flow lines from GRANIT data. • What is the condition of these culverts? • Students will do field work to gather structure, geomorphic, and aquatic organism passage data. • Are the culverts affecting the ecosystem? • Students will compare the ecosystems on both sides of the culvert to determine if species are able to cross the culvert. • Will the culvert withstand increased flow due to climate change? • Students will find the cross-section area of the culvert. Using estimates of future peak flow rates, students will determine if culverts are undersized. % of Town in Study Area • Pavement • As groundwater and sea levels rise, the base layers of some roads will be flooded more frequently. • More water can make the base layers of the roads less supportive. This can lead to cracking or rutting of the pavement surface or even cause the road to fail. Estimated base layers and thickness for NH interstate roads. Problem: Engineers need to know where roads are in danger as sea and groundwater levels rise so they can start planning for the future. Acknowledgements This research was supported with funding from the National Science Foundation’s Research Experience for Teachers in Engineering Grant (ENG-1132648). Hurricane Irene - damage to transportation network caused by flooded pavements. (AP Photo/Hans Pennink) • Summer Goals: • Use LiDAR elevation data to assign vertical positions to the tops of roads. • Identify areas where the any or all of the road base layers will be inundated with water after a 3ft sea level rise. • Identify areas where any or all of the road base layers will be inundated after a 3ft rise in groundwater levels. Literature Cited Bjerklie, D.M., Mullaney, J.R., Stone, J.R., Skinner, B.J., and Ramlow, M.A., 2012, Preliminary investigation of the effects of sea-level rise on groundwater levels in New Haven, Connecticut: U.S. Geological Survey Open-File Report, 2012–1025, 46 p., at http://pubs.usgs.gov/of/2012/1025/. Church, J.A., P.U. Clark, A. Cazenave, J.M. Gregory, S. Jevrejeva, A. Levermann, M.A. Merrifield, G.A. Milne, R.S. Nerem, P.D. Nunn, A.J. Payne, W.T. Pfeffer, D. Stammer and A.S. Unnikrishnan, 2013: Sea Level Change. In: Climate Change 2013: The Physical Science Basis. Contribution of Working Group I to the Fifth Assessment Report of the Intergovernmental Panel on Climate Change [Stocker, T.F., D. Qin, G.-K. Plattner, M. Tignor, S.K. Allen, J. Boschung, A. Nauels, Y. Xia, V. Bex and P.M. Midgley (eds.)]. Cambridge University Press, Cambridge, United Kingdom and New York, NY, USA, pp. 1137–1216, doi:10.1017/ CBO9781107415324.026. NOAA, 2011, Mean Sea Level Trend, 8419870 Seavey Island, Maine. (Accessed: August, 2014) http://tidesandcurrents.noaa.gov/sltrends/sltrends_station.shtml?stnid=8419870 Stack L, Simpson MH, Crosslin T, Roseen R, Sowers D, Lawson C. 2010. The Oyster River culvert analysis project. Syntectic International, Antioch University New England, Climate Techniques, the University of New Hampshire, and the Piscataqua Region Estuaries Partnership. Prepared for the Piscataqua Region Estuaries Partnership, Durham NH, and the EPA Climate Ready Estuaries Program. 16 Miles Within 20 Feet of Water Table Used GRANIT data for aquifer boundaries and water table contours. More work needs to be done to increase resolution and verify water table elevations. Future work will include modeling groundwater flow using USGS MODFLOW software.