Download
1 / 26
260 likes | 357 Views
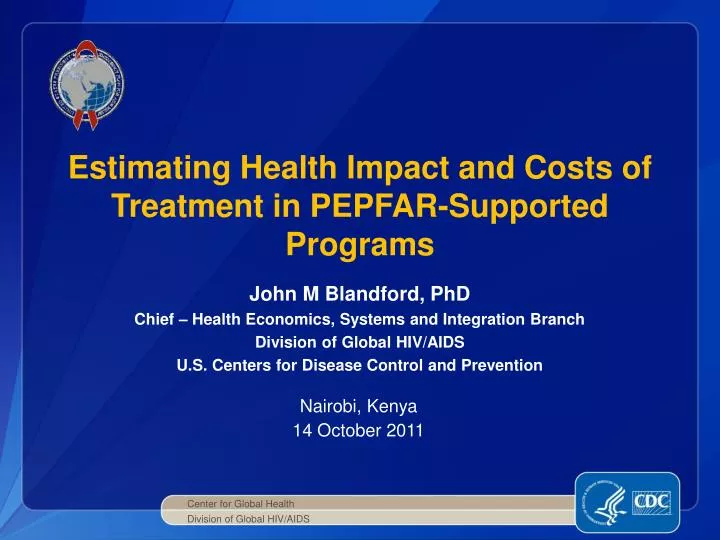
Estimating Health Impact and Costs of Treatment in PEPFAR-Supported Programs. John M Blandford, PhD Chief – Health Economics, Systems and Integration Branch Division of Global HIV/AIDS U.S. Centers for Disease Control and Prevention. Nairobi, Kenya 14 October 2011. Center for Global Health.

E N D
Estimating Health Impact and Costs of Treatment in PEPFAR-Supported Programs John M Blandford, PhD Chief – Health Economics, Systems and Integration Branch Division of Global HIV/AIDS U.S. Centers for Disease Control and Prevention Nairobi, Kenya 14 October 2011 Center for Global Health Division of Global HIV/AIDS
Evolving Use of Cost Data under PEPFAR Scale-Up of ART Access and Declining PEPFAR Per-Patient Costs, 2004-2009 Early emphasis on robust cost analyses and projections Support planning and efficient implementation Focus on total and USG costs for each patient-year of treatment Need to account more fully for societal impact of treatment Direct benefits to patient Indirect benefits to society Averted costs Note: Per-patient budget allocation is estimated as treatment allocation divided by lagged end-of-reporting direct patients.
Modeling the Impact and Costs of Treatment in PEPFAR-Supported Programs Two complementary analytic approaches: • Estimation of health impact and net societal cost of PEPFAR-supported treatment • Estimation of longer-term epidemic impact and costs of accelerated scale-up in light of HPTN 052
Modeling the Impact and Costs of Treatment Estimating Health impact and Societal Cost of Treatment under PEPFAR
PEPFAR ART Cost Model (PACM)Background • Developed to estimate resource requirements for treatment scale-up • Designed to inform USG planning at global and country levels • Utilizes data from multi-country PEPFAR ART Costing Project Study, other PEPFAR-supported studies • Open-cohort state-transition model • Model projects estimates of patient populations by patient type • Size of patient population, by patient type, recalculated on a quarterly basis • Direct treatment costs are estimated for each patient group • Model structure and assumptions reviewed by Government Accountability Office (GAO)
Estimation of Health Impact and Net Societal Cost of PEPFAR-Supported Treatment • Patient population and cost estimates are inputs for model of health impact and societal cost • Estimates the broad health of PEPFAR-supported treatment programs for patients and others who are impacted • Estimates societal cost of treatment, considering costs that are averted through effective treatment • Counterfactual: no program or program of different scale
Estimation of Health Impact and Net Societal Cost of PEPFAR-Supported Treatment Estimation of health impact from treatment • Direct benefit (to treatment patients) • HIV-attributable deaths averted • Life-years saved • Indirect benefit (to others) • Averted secondary infections • Sexual • Vertical: women who become pregnant while on ART • Averted orphanhood • Life-years saved Notes: A discount rate of 3% is used for calculation of future benefits and costs . Life-years saved do not currently account for quality or disability adjustments.
Estimation of Health Impact and Net Societal Cost of PEPFAR-Supported Treatment Estimation of net societal costs • Net costs = treatment costs – averted costs • Treatment costs • Total program costs • All sources of support (e.g., PEPFAR, GFATM, national) • Averted costs • Medical costs for HIV-related illness • ART for secondary infections • Orphan care • Note: Averted productivity losses are not currently estimated in the model Note: A discount rate of 3% is used for calculation of future benefits and costs . Life-years saved do not currently account for quality or disability adjustments.
Key Preliminary Findings of PACM Estimates • For every one patient-year of HIV treatment provided, 2.2 discounted life-years are gained for society • For every 1000 patient-years of PEPFAR-supported HIV treatment provided: • 228 HIV patients avert death • 449 children avert orphanhood • 61 sexual transmissions are averted • 26 vertical (mother-to-child) transmissions are averted
Key Preliminary Findings of PACM Estimates • Cost savings to society that result from averted negative outcomes equal 59% of total treatment program costs • The net societal cost of treatment is $147 per discounted life-year gained when the indirect benefits and averted costs from treatment are considered • Based on WHO standards for cost-effectiveness, ART may potentially be highly cost-effective in most of sub-Saharan Africa
5 years 10 years 1 year Infections Averted per 1,000 Patient-Years of Treatment Source: Tim Hallett, Imperial College; The Impact of Treatment on HIV Incidence: Perspective from Epidemiology & Modelling
Current Limitations of PACM Estimates • Input parameter for secondary sexual transmissions that occur from non-acute PLWHA not on treatment requires further validation • Base-case: Rate of 0.070 implies $147 per life-year saved • CI: Rate of 0.560 – 0.930 implies $172 - $110 per life-year saved • Model does not capture dynamic effects of increased treatment coverage reducing community infectiousness • Inclusion would likely improve estimated cost-effectiveness • No quality or disability adjustments currently estimated for life-years saved • Inclusion would worsen estimated cost-effectiveness • Productivity gains from averted mortality and morbidity not currently estimated • Inclusion would improve estimated cost-effectiveness
Modeling the Impact and Costs of Treatment Preliminary projections: Epidemic Impact and Cost of Accelerated Scale-up
Modeling the Impact and Costs of Treatment in PEPFAR-Supported Programs Two complementary analytic approaches: • Estimation of health impact and net societal cost of PEPFAR-supported treatment • Estimation of longer-term epidemic impact and costs of accelerated scale-up in light of HPTN 052
Modeled Example: Accelerated Treatment Scale-Up in Kenya • Desire to understand the potential epidemic impact and resource implications of accelerated treatment scale-up, in light of HPTN 052 findings • What might be done in light of global health resource constraints? • Understand the magnitude of economies required to allow accelerated scale-up • Collaboration with John Stover (Futures Institute) • Model based on AIDS Impact Model (AIM)/Spectrum to estimate epidemic impact and cost • Cost parameters derived from CDC’s PEPFAR ART Cost Model • Kenya chosen as an example setting
Modeled Scenario: Rapid expansion of ART to patients already identified as HIV-infected Priority groups for accelerated access in scenario: • Patients with CD4 <500 cells/µl already on waiting lists for ART or in pre-ART care • Lifelong ART to pregnant and breastfeeding women regardless of CD4 cell count • Patients with active tuberculosis (TB) • Persons known to be in serodiscordant couples regardless of CD4 count
Modeled Scenario: Rapid expansion of ART to patients already identified as HIV-infected Efficiency gains: Utilizing a public health approach to treatment, it is assumed that costs might be further reduced • Standardized package of care and treatment • Increased task-shifting • Decentralization of care • Streamlined commodity procurement and management • For Kenya example • Treatment cost decline is modeled to decrease from $668 to $491, over 5 years (26.5% decrease compared to current) • Base case: Maintenance of 2011 coverage, no efficiency gains
Base-Case for Kenya Projects 70% Coverage of Those Eligible for Treatment (CD4<350) Based on PEFPAR 2011 APR data
To Maintain Base Treatment Coverage, Continued Increase in Treatment Required
Treatment Resources Would Need to Increase to Maintain Base Coverage Levels
With Accelerated Scale-Up an Additional 323,000 are Moved to Treatment from Current Clinical Care and PMTCT Based on population estimates in the following priority populations: patients in care with CD4<500, PMTCT patients, HIV patients with active TB, known PLHA in sero-discordant couples
Accelerated Scale-Up Results in Annual Decline in New HIV Infections Under the base-case scenario, incident HIV infections remain relatively constant at or above 120,000 new cases per year. With accelerated treatment scale-up, incident HIV infections could be driven down to ~86,500 by 2015.
Per Patient ART Costs ($/patient), under Base Case and Efficiency Assumptions
Under Accelerated Scenario Annual Treatment Costs Reach Steady State Over Time Millions Estimated costs to maintain current coverage levels in the Base Case and Accelerated Scale-Up Scenario. Flattened treatment costs in the accelerated scale-up scenario reflect effects of declining HIV incidence and additional implementation efficiency.
Preliminary Findings from Accelerated Treatment Projections for Kenya • Accelerated scale-up could reduce incident infections by 31% over five years • A flattened program results in steady incidence and a growing population of those in need of treatment • With reasonable assumptions for continued efficiency gains, accelerated scale-up possible within constrained budget • In the longer term, accelerated scale-up may be cost-saving • Over five years in the context of the Kenyan epidemic, 93 infections are projected to be averted for every additional 1000 patient-years of treatment provided
Acknowledgments John Stover – Futures Institute NalineeSangrujee – CDC-Atlanta Nick Menzies – Harvard, CDC-Atlanta J. Michel Tcheunche – CDC-Atlanta Vimalanand Prabhu – CDC-Atlanta KiprutoChesang – CDC-Kenya Lucy Nganga – CDC-Kenya Andrea Kim – CDC-Kenya Nancy Knight – CDC-Kenya Jan Moore – CDC-Atlanta Laura Broyles – CDC-Atlanta Center for Global Health Division of Global HIV/AIDS