Download
1 / 11
210 likes | 429 Views
Mean from frequency table. ABC Motoring. Here are the number of tests taken before successfully passing a driving test by 40 students of “ABC Motoring”. 2, 4, 1, 2, 1, 3, 7, 1, 1, 2, 2, 3, 5, 3, 2, 3, 4, 1, 1, 2, 5, 1, 2, 3, 2, 6, 1, 2, 7, 5, 1, 2, 3, 6, 4, 4, 4, 3, 2, 4.

E N D
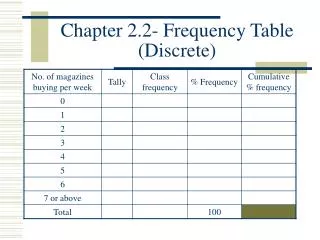
ABC Motoring Here are the number of tests taken before successfully passing a driving test by 40 students of “ABC Motoring” 2, 4, 1, 2, 1, 3, 7, 1, 1, 2, 2, 3, 5, 3, 2, 3, 4, 1, 1, 2, 5, 1, 2, 3, 2, 6, 1, 2, 7, 5, 1, 2, 3, 6, 4, 4, 4, 3, 2, 4 It is difficult to analyse the data in this form. We can group the results into a frequency table.
ABC Motoring That’s better!
Finding the Mean Remember, when finding the mean of a set of data, we add together all the pieces of data. This tells us that there were nine 1’s in our list. So we would do 1+1+1+1+1+1+1+1+1 = 9 It is simpler to use 1x9!! We can do this for every row.
Finding the Mean 40 107 So we have now added all the values up. What do we do now? We divide by how many values there were. So we divide by the total number of people. We now need to add these together
40 107 The Mean is 107÷ 40 = 2.7 (1dp)
ABC Motoring Students who learn to drive with ABC motoring, pass their driving test after a mean number of 2.7 tests.
Here are the Year Ten boys’ javelin scores. Grouped data How could you calculate the mean from this data? How is the data different from the previous examples you have calculated with? Because the data is grouped, we do not know individual scores. It is not possible to add up the scores.
Midpoints It is possible to find an estimate for the mean. This is done by finding the midpoint of each group. To find the midpoint of the group 10 ≤ d < 15: 10 + 15 = 25 25 ÷ 2 = 12.5 m Find the midpoints of the other groups.
Javelin distances in metres Frequency f Midpoint x Frequency × midpoint fx 5 ≤ d < 10 1 10 ≤ d < 15 8 15 ≤ d < 20 12 20 ≤ d < 25 10 25 ≤ d < 30 3 30 ≤ d < 35 1 35 ≤ d < 40 1 Estimating the mean from grouped data 7.5 1 × 7.5 = 7.5 12.5 8 × 12.5 = 100 17.5 12 × 17.5 = 210 22.5 10 × 22.5 = 225 27.5 3 × 27.5 = 82.5 32.5 1 × 32.5 = 32.5 37.5 1 × 37.5 = 37.5 TOTAL 36 695 Estimated mean = 695 ÷ 36 = 19.3 m (to 1 d.p.)