Download
1 / 15
160 likes | 420 Views
Vital Signs. Start. TABLE OF CONTENTS. Spirometer. Electrocardiogram. Click on a Topic. Vital Signs. Spirometer. Vital Signs. Electrocardiogram (EKG). EKG Phases: Ventricular Phases. EKG Phases: Comparison of Atrial and Ventricular Phases. Lead 2 EKG Components. Vital Signs.

E N D
Vital Signs Start
TABLE OF CONTENTS Spirometer Electrocardiogram Click on a Topic Vital Signs
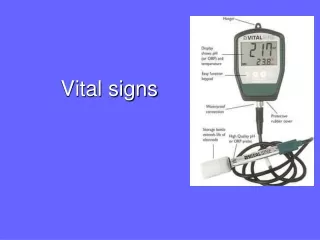
Spirometer Vital Signs
Electrocardiogram (EKG) EKG Phases: Ventricular Phases EKG Phases: Comparison of Atrial and Ventricular Phases Lead 2 EKG Components Vital Signs
Ventricular Phases Ventricular Ejection (0.25 sec) Isovolumetric Relaxation (0.08 sec) Ventricular Filling (0.42 sec) Isovolumetric Contraction (0.05 sec) Ventricular Diastole Ventricular Systole Vital Signs
Comparison of Atrial and Ventricular Phases Atrial Systole (0.1 sec) Atrial Diastole (0.7 sec) Ventricular Diastole (0.5 sec) Ventricular Systole (0.3 sec) Vital Signs
Lead 2 EKG Components Click on an area to identify it Vital Signs
The P Wave: Caused by atrial depolarization; as a result, the myocardium surrounding the two atria contracts. This is the beginning of ATRIAL SYSTOLE. Vital Signs
The QRS Complex (0.05-0.12 sec.): Caused by ventricular depolarization; as a result, the myocardium surrounding the two ventricles contracts. This is the beginnining of VENTRICULAR SYSTOLE. The QRS complex also masks atrial repolarization, since it occurs at the same time. As a result, the myocardium surrounding the two atria relaxes. Therefore, this is also the beginning of ATRIAL DIASTOLE. Vital Signs
The T Wave (0.12 sec.): Caused by ventricular repolarization; as a result, the myocardium surrounding the two ventricles relaxes. This is the beginning of VENTRICULAR DIASTOLE. Vital Signs
The P-Q (or P- R) Interval (0.12-0.2 sec.): The period of time from the beginning of ATRIAL DEPOLARIZATION to the beginning of VENTRICULAR DEPOLARIZATION. This represents the time it takes for the electrical signals to pass from the SA node to the Purkinje fibers. Vital Signs
The Q-T Interval (0.3 sec.) The period of time from the beginning of VENTRICULAR DEPOLARIZATION to the end of VENTRICULAR REPOLARIZATION. This represents the time it takes for the electrical signals to pass through the myocardium surrounding the two ventricles, followed by a wave of repolarization. Vital Signs
The Isoelectric Line or Baseline: The period of time when either no electrical signals are passing through the myocardium (during ATRIAL DIASTOLE and VENTRICULAR DIASTOLE) or the net electrical signal is perpendicular to the LEAD (direction between 2 electrodes on the surface of the skin). Vital Signs
The Isoelectric Line or Baseline: The period of time when either no electrical signals are passing through the myocardium (during ATRIAL DIASTOLE and VENTRICULAR DIASTOLE) or the net electrical signal is perpendicular to the LEAD (direction between 2 electrodes on the surface of the skin). Vital Signs
The ST segment: The period of time from the end of VENTRICULAR DEPOLARIZATION to the beginning of VENTRICULAR REPOLARIZATION. Vital Signs