Download
1 / 28
280 likes | 403 Views
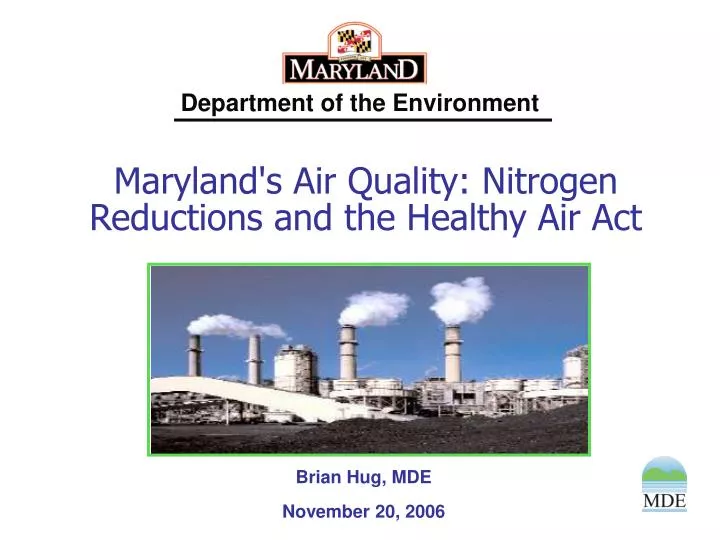
Maryland's Air Quality: Nitrogen Reductions and the Healthy Air Act. Brian Hug, MDE November 20, 2006. Maryland’s Air Quality. We have problems with long term ozone exposure Fine particulate levels are generally very close to the federal standard Regional Haze issues

E N D
Maryland's Air Quality: Nitrogen Reductions and the Healthy Air Act Brian Hug, MDE November 20, 2006
Maryland’s Air Quality • We have problems with long term ozone exposure • Fine particulate levels are generally very close to the federal standard • Regional Haze issues • Air pollution contributes significantly to Bay pollution
PM2.5 and 8Hr Ozone Nonattainment Areas Source: EPA
Good News – Ozone Levels • Ground Level Ozone • Monitored levels are lower than they have ever been • We came very very close to meeting the old ozone standard • Some regions of Maryland actually have achieved both the old and the new ozone standard • Maryland areas designated “Moderate” under new standard • Not “Severe” as they were under 1-hour standard
May-Sep, 1999-2002 May-Sep, 2003-2006 8-hr Ozone by Color Code More Good News on Ozone Levels • Maryland areas designated as “Moderate” under new standard • Not “Severe” as they were through 2005 • Many counties already monitor levels below the new standard • Exceedance days under the new standard have also dropped dramatically • 2003 to 2006 • 70 Days above the standard • 1999 to 2002 • 135 Days above the standard • Bad air days are generally cleaner (lower monitored levels) and occur in smaller areas *2006 is data is preliminary
http://www.lippmannforcongress.us/air%20pollution.jpg Good News – Local Reductions • Maryland has implemented one of the country’s most aggressive set of air pollution control regulations • Power plants to hair spray and perfume • Over 100 different regulations since 1990 • Emissions in Maryland have been cut by about 40% since 1990 • National average is about 20%
Good News – Mobile Source Reductions • Maryland programs like the our vehicle inspection program combined with federal motor vehicle emission requirements have reduced mobile source emissions in Maryland by about 50% since 1990. • Significant additional reductions are phased in in 2004 and 2007 • By 2030 mobile source emissions are projected to be 11% of what they were in 1990. • These reductions include significant projected growth in Vehicle Miles Traveled (about 40%)
History of Power Plant Controls • Three Phases • NOx RACT • 1995 • About a 20 to 30 percent reduction in MD • Ozone Transport Commission (OTC) MOU • 1999/2000 • About a 65% reduction • The “SIP Call” • 2003/2004 • About a 85% reduction
Good News – Power Plant Reductions • Significant reductions from regional power plants between 2002 and 2005 • Billions of dollars being invested in “Selective Catalytic Reduction” (SCR) technology to reduce power plant NOx emissions SCR By State Over 50 % of the coal-fired capacity in key upwind states will be controlled with SCR by 2005 1 to 25 % 26 to 49% 50 % or greater
Counts of Major NOxPoint Source >= 25 tons/year Number of SCR Installationsas of 2006 Where Are the SCR Being Installed? Majority of SCR installation in states “upwind” of Maryland
Through the use a cap and trade approach, CAIR requires reductions of sulfur dioxide (SO2) and nitrogen oxides (NOx)emissions by EGU’s. • SO2 and NOx contribute to the formation of fine particles and NOx contributes to the formation of ground-level ozone. • CAIR covers 28 eastern states and the District of Columbia. CAIR Basics
CAIR CAPS Emission Caps (million tons) Annual SO2: 2010 = 3.6 2015 = 2.5 Annual NOx 2009 = 1.5 2015 = 1.3 Seasonal NOx: 2009 = 0.58 2010 = 0.48 Source: EPA
CAIR in 2010 Source: EPA
CAIR in 2015 Source: EPA
NOx Emissions (thousand tons) 2003 2009 2015 Maryland NOx emissions without CAIR 68 57 57 Maryland NOx emissions with CAIR N/A 16 12 CAIR Reduces Maryland’s SO2 Emissions According to EPA, By 2015 CAIR will help Maryland sources reduce emissions of nitrogen oxides (NOx) by 56,000 tons or 82%* from 2003 levels. Maryland NOx Benefits * These assumptions do not include “cap and trade” via IPM Modeling Source: EPA
CAIR in the MD Region Source: EPA
The Maryland Healthy Air Act • Imposes upon Maryland’s largest coal-fired electric generating units emission emission caps on pollutants that contribute to ozone, particles, regional haze, acid rain, and bay pollution • Reduces mercury emissions from all MD coal-fired electric generating units • Prohibits Maryland power plants from acquiring out-of-state emissions allowances (trading) to meet emission caps
History of the HAA • For the past several years there has been a growing consensus in the MD general assembly that a power plant pollution law was needed • Several MD legislators continued to push the need for a law • This past year the Healthy Air Act was developed in conjunction with the developing Maryland Clean Power Regulations as a means of controlling power plant emissions • This much debated law was signed by the Governor on April 7th, 2006
Coal Fired Power Plants Covered by the Healthy Air Act R Paul Smith
Maryland Healthy Air Act Largest Maryland Emission Reductions Ever 2006 1980-2002 2003 2004 1997 1993 2004 Regulations * Sulfur Dioxide (SO2), Nitrogen Oxides (NOx), and Volatile Organic Compounds (VOC)
Meeting the New Standards • Preliminary photochemical modeling analysis indicates that Maryland will attain the fine particulate standard and come very close* to the new ozone standard with stringent power plant rules like the HAA • Reductions from upwind power plants are also critical • Without the reductions from the Healthy Air Act … • Maryland will not be able to comply • Public health will remain at risk
CAIR Plus is an initiative being worked on by the OTC states to strengthen the air quality benefits of the CAIR program. • The EPA’s CAIR modeling does not show attainment for all of the states in the OTC (at least for ozone) • In order to attain both the 8-hour ozone standard and the PM2.5 standard in the timeframe allotted by the CAA, the OTC agreed to pursue a “tougher than CAIR” option What is CAIR Plus?
Basically, the proposed CAIR Plus program will reduce the total number of CAIR allowances being issued to sources by a percentage to further reduce emissions • The OTC is working on a model rule for this initiative • Stakeholders have been very active in the process What does CAIR Plus do?
Thanks…..Brian HugActing Deputy Program ManagerAir Quality Planning Program410-537-4125bhug@mde.state.md.us