Download
1 / 1

E N D
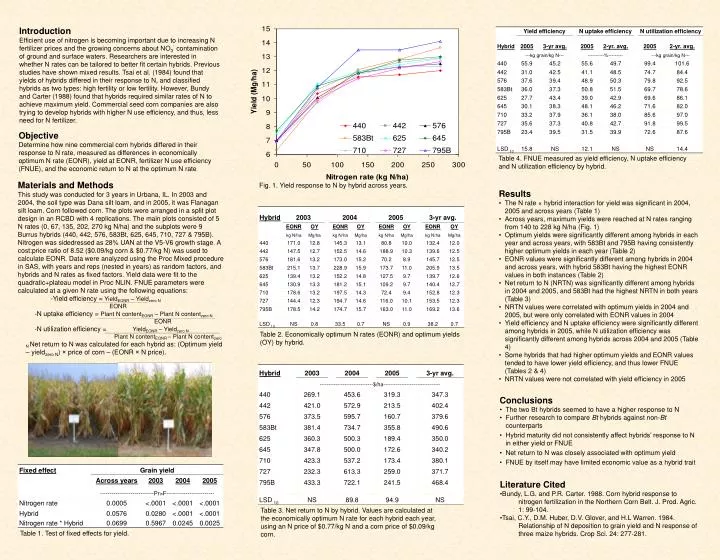
Introduction Efficient use of nitrogen is becoming important due to increasing N fertilizer prices and the growing concerns about NO3- contamination of ground and surface waters. Researchers are interested in whether N rates can be tailored to better fit certain hybrids. Previous studies have shown mixed results. Tsai et al. (1984) found that yields of hybrids differed in their response to N, and classified hybrids as two types: high fertility or low fertility. However, Bundy and Carter (1988) found that hybrids required similar rates of N to achieve maximum yield. Commercial seed corn companies are also trying to develop hybrids with higher N use efficiency, and thus, less need for N fertilizer. Objective Determine how nine commercial corn hybrids differed in their response to N rate, measured as differences in economically optimum N rate (EONR), yield at EONR, fertilizer N use efficiency (FNUE), and the economic return to N at the optimum N rate Table 4. FNUE measured as yield efficiency, N uptake efficiency and N utilization efficiency by hybrid. • Materials and Methods • This study was conducted for 3 years in Urbana, IL. In 2003 and 2004, the soil type was Dana silt loam, and in 2005, it was Flanagan silt loam. Corn followed corn. The plots were arranged in a split plot design in an RCBD with 4 replications. The main plots consisted of 5 N rates (0, 67, 135, 202, 270 kg N/ha) and the subplots were 9 Burrus hybrids (440, 442, 576, 583Bt, 625, 645, 710, 727 & 795B). Nitrogen was sidedressed as 28% UAN at the V5-V6 growth stage. A cost:price ratio of 8.52 ($0.09/kg corn & $0.77/kg N) was used to calculate EONR. Data were analyzed using the Proc Mixed procedure in SAS, with years and reps (nested in years) as random factors, and hybrids and N rates as fixed factors. Yield data were fit to the quadratic+plateau model in Proc NLIN. FNUE parameters were calculated at a given N rate using the following equations: • -Yield efficiency = YieldEONR – Yieldzero N • EONR • -N uptake efficiency = Plant N contentEONR – Plant N contentzero N • EONR • -N utilization efficiency = YieldEONR – Yieldzero N • Plant N contentEONR – Plant N contentzero N Net return to N was calculated for each hybrid as: (Optimum yield – yieldzero N) × price of corn – (EONR × N price). Fig. 1. Yield response to N by hybrid across years. • Results • The N rate × hybrid interaction for yield was significant in 2004, 2005 and across years (Table 1) • Across years, maximum yields were reached at N rates ranging from 140 to 228 kg N/ha (Fig. 1) • Optimum yields were significantly different among hybrids in each year and across years, with 583Bt and 795B having consistently higher optimum yields in each year (Table 2) • EONR values were significantly different among hybrids in 2004 and across years, with hybrid 583Bt having the highest EONR values in both instances (Table 2) • Net return to N (NRTN) was significantly different among hybrids in 2004 and 2005, and 583Bt had the highest NRTN in both years (Table 3) • NRTN values were correlated with optimum yields in 2004 and 2005, but were only correlated with EONR values in 2004 • Yield efficiency and N uptake efficiency were significantly different among hybrids in 2005, while N utilization efficiency was significantly different among hybrids across 2004 and 2005 (Table 4) • Some hybrids that had higher optimum yields and EONR values tended to have lower yield efficiency, and thus lower FNUE (Tables 2 & 4) • NRTN values were not correlated with yield efficiency in 2005 Table 2. Economically optimum N rates (EONR) and optimum yields (OY) by hybrid. • Conclusions • The two Bt hybrids seemed to have a higher response to N • Further research to compare Bt hybrids against non-Bt counterparts • Hybrid maturity did not consistently affect hybrids’ response to N in either yield or FNUE • Net return to N was closely associated with optimum yield • FNUE by itself may have limited economic value as a hybrid trait • Literature Cited • Bundy, L.G. and P.R. Carter. 1988. Corn hybrid response to • nitrogen fertilization in the Northern Corn Belt. J. Prod. Agric. • 1: 99-104. • Tsai, C.Y., D.M. Huber, D.V. Glover, and H.L Warren. 1984. • Relationship of N deposition to grain yield and N response of • three maize hybrids. Crop Sci. 24: 277-281. Table 3. Net return to N by hybrid. Values are calculated at the economically optimum N rate for each hybrid each year, using an N price of $0.77/kg N and a corn price of $0.09/kg corn. Table 1. Test of fixed effects for yield.