Download
1 / 21
220 likes | 298 Views
MICROCLIMATE EFFECTS ON ATMOSPHERIC CARBON DIOXIDE GROUP WORK BASED ON THE PRAIRIE RIDGE PROJECT MEA 760: BIOGEOCHEMISTRY WILFRED AKAH September 21, 2006. Climate and Climate Processes - Why climatology: climate as a constraint for geological processes

E N D
MICROCLIMATE EFFECTS ON ATMOSPHERIC CARBON DIOXIDE GROUP WORK BASED ON THE PRAIRIE RIDGE PROJECT MEA 760: BIOGEOCHEMISTRY WILFRED AKAH September 21, 2006
Climate and Climate Processes - Why climatology: • climate as a constraint for geological processes • climate as a constraint for environmental/ ecological/evolutionary processes • climate as a constraint for human society • understanding the climate system is a prerequisite for understanding the anthropogenic impact on environment and climate
Climate: “Climate is the set of weather conditions typical of a given region together with the frequency of these conditions and their seasonal variations.” (Monin 1986) Thus: “climate” denotes the mean weather and the statistical weather distribution of a certain area as determined over a certain number of years (frequently 30 years; reference climate: 1931-1960).
Present-day climate is a result of the interaction of various components and factors. Climate conditions at a location is suitably described by the parameters: • Solar radiation • Temperature • Precipitation and • Air pressure (Dommergues, 1979)
Climate classification The generic climate classifications of Flohn (1950) regards: Equatorial westerly zone: constantly wet 2. Tropical zone, winter trades: summer rain 3. Subtropical dry zone (trades or subtropical high) 4. Subtropical winter-rain zone: winter rain 5. Extra-tropical westerly zone: precipitation through the year 6. Subpolar zone: less precipitation through the year 7. High polar zone: sparse precipitation, summer rain, early winter snow
Relevant climate parameters: • mean annual temperature (MAT) • mean temperature of the coldest month (CMT) • mean temperature of the warmest month (WMT) • mean annual precipitation (MAP) • mean precipitation of driest month
Spatial Scales of Climate: • Microclimate: mm to 100 m • Mesoclimate: 100 m to 100km • Macroclimate: 100 km to 10,000 km Climate system: “Atmosphere, land, ocean, ice and biosphere together form the climate system.” (IPCC 1995) The climate system is influenced by extraterrestrial factors, in particular by solar radiation.
Components of the Climate System and External Factors External Factors: • The Sun • Geometry and Orbital Parameters of the Earth Components of the Climate System: • Atmosphere • Land • Ocean • Ice • Biosphere
Average Composition of the Atmosphere (below 25 km, dry air): • Nitrogen, N2 78 vol.% (dry air) • Oxygen, O2 20.95 • Argon, Ar 0.93 • Carbon dioxide, CO2 0.035 350 ppm • Neon, Ne 0.0018 • Krypton, Kr 0.0011 • Helium, He 0.0005 • Methane, CH4 0.00017 1700 ppb • Ozone, O3 0.00006 • Hydrogen, H 0.00005
Greenhouse Gases (Data from 1991) Gas Concentration Increase/a CO2 355(280)ppm 0.5% CH4 1.7(0.8)ppm 0.9 CFM 0.3(0)ppb 4% N2O 0.31(0.29)ppb 0.25% O3 30(?)ppb 1%(?)
Global Cycles of Atmospheric Greenhouse Gases: Carbon Reservoirs (pre-industrial/recent): • Atmosphere: 600/750 Gt C • Land Biota: 610/550 Gt C • Soil/Detritus: 1560/1500 Gt C • Marine Biota: 3/3 Gt C • Ocean: – surface: 1000/1020 Gt C – DOC: 700/700 Gt C – interm. & deep: 38000/38100
Humidity and precipitation Humidity: Measurement of the proportion of water vapor in the atmosphere (relative and absolute). Humidity depends on temperature. The higher air temperature is, the more water vapor can be incorporated. Important processes which can change humidity: Evaporation: • Energy supply causes change from liquid water to water vapour at temperatures below the boiling point Condensation: • Occurs when relative humidity is 100% and temperature further decreases, leads then to condensation, clouds and likewise to Precipitation Freezing: • Temperature decrease below 0°C in the atmosphere
Anthropogenic Concentration of greenhouse gases since 250 years
Tropical forest Energy Chemistry Agriculture Destruction of forest Co2 and other trace gases Air pollution: CO2, NO2, Cox, CH4 Production, application CFC Fertilization: N2O, CH4
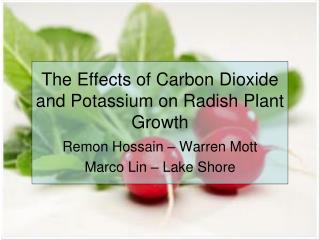
CO2 in Relation to Plants At the photosynthesis level, there are three main plant groups C3, C4, and CAM (Craussulacean Acid Metabolism) plants. • Examples of C3 plants Soybean, wheat, rice, and potato. • The C4 pathway is found in tropical grass crops like corn, sugarcane, sorghum and some members of the families Chenopodia Ceae and Arnaranthaceae. • The C4 plants are more efficient in photosynthesis than the C3 plants. • In C3 plants, 20-50 % of the carbon fixed is immediately lost by photorespiration. • In contrast, C4 plants exhibit little photorespiration.
In comparison to these two plant types, the CAM plants are a form of C4 except that the CO2 is fixed at night and then processed via a C3 pathway during the day. CAM plants include pineapple and succulent vegetation like Cacti and stone crops: they are highly efficient users of water.
Temperature change in the Atmosphere: • Mid-tropospheric (850-300mb) temperatures have increased between the 1970s and 1990s, in parallel with surface temperature. • In the upper troposphere (300-100mb) there has been a steady decline in temperature of about 0.4°C since the 1960s. • Temperatures in the lower stratosphere (100-50mb) show the greatest change, especially since 1980. It is mostly attributed to changes over and around Antarctica, probably related, in part, to the decrease in springtime stratospheric ozone.
Precipitation, cloud cover and sea-level change: • With globally increasing temperatures, increases in global precipitation would be expected due to the greater rates of evaporation of sea surface water. • Observations however, show for the last few decades an increase in the mid-latitudes, decrease in the Northern Hemisphere subtropics and increase throughout the Southern Hemisphere. • Increased global cloudiness also would be an expected consequence of higher global temperatures. • Over Europe, Australia, Indian sub-continent and North America annual mean cloudiness has increased by 6% to 10%. • Increasing greenhouse gases are expected to cause a rise in the global mean sea level, due partly to oceanic thermal expansion and partly to the melting of land-based ice masses.
Prediction of future climate change is assessed when using simulation models which include components of the climate system and their physical features. Mostly, General Circulation Models (GCM) are used. Associated with a doubling of pre-industrial atmospheric CO2, the following conclusions have been made: • A global average warming at or near the Earth's surface of between 1.5 and 4.5°C, with a "best guess" of 2.5°C, will occur • The stratosphere will experience a significant cooling • Surface warming will be greater at high latitudes in winter, but less during the summer • Global precipitation will increase by 3% to 15% • Year-round increases in precipitation in high-latitude regions are expected, whilst some tropical areas may experience small decreases