Download
1 / 24
240 likes | 423 Views
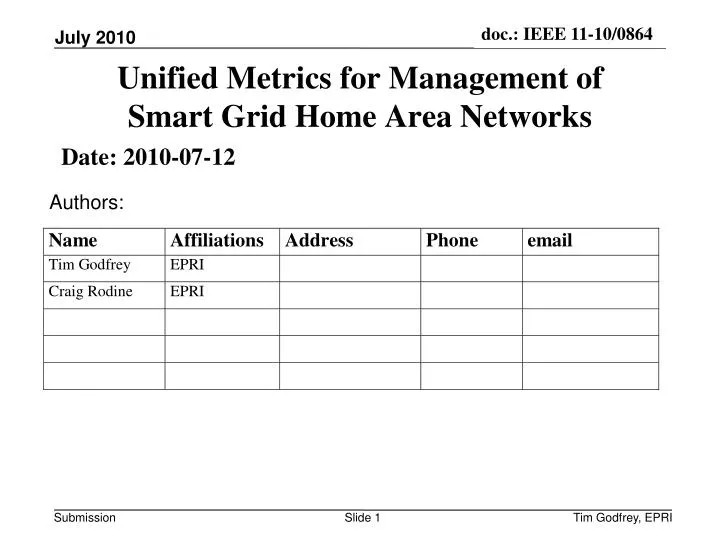
Unified Metrics for Management of Smart Grid Home Area Networks. Date: 2010-07-12. Authors:. Unified Metrics for Management of Smart Grid Home Area Networks. IEEE International Communications Conference Smart Grid Communication Workshop 23 May 2010 Tim Godfrey Craig Rodine.

E N D
Tim Godfrey, EPRI Unified Metrics for Management of Smart Grid Home Area Networks • Date: 2010-07-12 Authors:
Unified Metrics for Management of Smart Grid Home Area Networks IEEE International Communications Conference Smart Grid Communication Workshop 23 May 2010 Tim Godfrey Craig Rodine
EPRI Corporate Overview (www.epri.com) Not-for-profit, membership org; executes research programs for US and international utilities Annual budget ~$350Mn USD; 800 employees; 8 offices (6 US,2 int’l); 3 laboratories (US) 100s of EPRI utility members represent >90% of electricity generated in the USA Divisions: Generation, Nuclear, Power Delivery & Utilization, Environment, Renewable Energy, Energy Efficiency, Technology Innovation R&D Priorities include: Next generation nuclear, coal, and natural gas power plants CO2 capture and storage technologies Smart grid technologies Cost-competitive, grid-compatible renewable generation Reliable, long-lived power systems components and infrastructure Efficient power system and customer electro-technologies PHEV-compatible power delivery networks Science to inform environmental decision-making
Home Area Network (HAN) Overview Home Area Networks (HANs) allow electric utilities to offer energy services to their customers through a gateway or Energy Services Interface. This function can be offered via a broadband Internet connection, or the utility AMI system via an interface on the Smart Meter. We are studying three leading SDO-backed HAN technology families: Zigbee (IEEE 802.15.4) Homeplug AV/GP-SE (IEEE P1901) Wi-Fi (IEEE 802.11 b/g/n)
HAN Comms Reliability AMI Systems need to support end-to-end communications for Demand Response, Pre-Pay, PEV Charging, and similar retail energy services. Communication between devices via the Home Area Network (HAN) thus becomes a mission-critical resource for utilities and energy service providers. Problem: there are no standardized ways to determine the status, health and performance of communications over wireless or wired HAN technologies.
Objectives for HAN Metrics • Verify at installation time that a HAN device has established reliable communications with a controller or peer. • Enable operators to check that a HAN device or controller is communicating reliably post-installation. • Establish diagnostics and metrics to help operators identify problems and minimize the HAN service burden. • Establish baseline performance metrics that are comparable across popular HAN standards – Wi-Fi, Zigbee, HomePlug.
PHY Layer Metrics • Link Quality – an abstract concept (dimensionless value), independent of underlying network technology • By nature, PHY metrics are per-connection. • Maintained for each peer address • Data rates and link quality are inter-related for some standards • Signal strength and background noise are other useful PHY metrics • IEEE standards provide PHY metrics as part of the PHY Data SAP, and the PLME SAP
Per-connection and Per-device Metrics • PHY metrics such as link quality and signal strength are per-connection. The value is associated with the connection to a peer device. • Example PHY Metrics • Metrics drop out of list w/ age • Table size implementation dependent • MAC Metrics are per-device • They represent the status of a particular device’s MAC. • Statistics are maintained for all RX and TX frames • Higher layers can track per-connection if needed
MAC Layer Metrics • PHY Layer metrics (Energy and Link Quality) do not give a complete picture of network performance • Errors due to periodic variation between PHY measurements times and actual times transmission and reception • The MAC works with the PHY to transfer information • Internal behavior & state represent useful information • Like PHY metrics, MAC layer metrics can be gathered passively, by monitoring the behavior of existing traffic as it is sent and received on the network • No overhead is added by gathering metrics
Metrics for 802.15.4 (Zigbee) • The existing standard 802.15.4 does not include MAC layer metrics. • The “philosophy” of 802.15.4 is to keep the MAC very simple and small • Many applications require low power and low cost • The complex measurements of 802.11k and P1901 would not be acceptable. • A subset of the MAC metrics were defined to provide the best visibility of behavior for Smart Grid applications. • These metrics are included in the 802.15.4 amendment developed by Task Group 4e
Derivation of Metrics from Existing Standards • Selected Subset
Derivation of Metrics from Existing Standards • Selected Subset - extended to 802.15.4
Standards-Independent Metrics • A consistent set of metrics across multiple HAN standards • Simplifies central management and monitoring software • Give utilities flexibility in deploying HANs • The selected subset of MAC and PHY metrics may be adapted to new HAN standards as they are developed
Interpretation of Metrics - Transmit • MAC transmit metrics are primarily derived from retry and acknowledgement behavior • Represent the amount of “effort” the MAC has to make to send a packet • Retry behavior represents different types of network impairments Interference Bursts Good RF conditions Weak Signal
Interpretation of Metrics - Receive • FCS (Frame Check Sequence) or ICV (Integrity Check Value) failure. • Typically a CRC over the frame’s data payload • A mismatch in the FCS or ICV indicates an error. • Duplicate Frames • When an ACK is not received, the sender retries the transmission. • Duplicate frame at receiver meanssender did not receive the ACK • Possibly interference local to the sender Transmit Receive Frame N ACK X Lost Retry Frame N Duplicate
Architecture for communicating metrics Per-device statistics may be made accessible in management entity e.g. SNMP SNMP SET/GET MAC metrics MAC metrics MIB MAC MIB or PIB MAC MIB or PIB MAC MAC Mgmt Entity Mgmt Entity PHY PHY Measure Report Measure Request Remote Device Remote metrics carried over network Coordinator or Access Point
Communicating metrics over the HAN • 802.11 and P1901 provide standardized mechanisms for communicating metrics over the network • 802.11 defines a type of management frame (action frame) with information elements carrying the metrics • P1901 defines management messages that can be carried over the power line network or Ethernet. • 802.15.4 does not define a mechanism to communicate metrics over the air interface. • Possible future work for 802.15.4
Application for dynamic fragmentation • 802.15.4g (Smart Utility Network) targets neighborhood area connectivity between Smart Meters • Data rates are 5 – 400 Kb/S • The 802.15.4g Project Authorization Request (PAR) specifies PHY frame sizes up to 1500 octets (i.e. for transport of Ethernet packets). • Packet transmission times up to 2.4 S would result in very low reliability. • Fragmentation at higher layers will be required, but what is the optimum size? • MAC metrics provide a basis for dynamically setting the proper fragmentation size based on conditions.
Scenario for system level metrics application HAN Metrics gathered by Remote Devices (RD) Metrics monitored over HAN by Energy Gateway (EGW) EGW contains an SNMP Agent Represents metrics for all RD’s in HAN Utility Management and System consolidates and monitors metrics from all HANs -(independent of HAN network technology EGW EGW RD RD RD RD RD RD EGW RD RD RD Internet Utility Management System HAN (Wi-Fi, HomePlug, Zigbee) Internet (WAN)