Download
1 / 32
330 likes | 521 Views
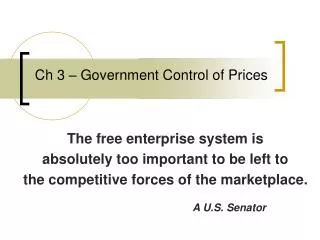
Government Control of Prices in Mixed Systems. Supply, Demand, and Government Policies. In a free, unregulated market system, market forces establish equilibrium prices and exchange quantities. Prices in mixed systems are not necessarily a response to market demand and supply

E N D
Supply, Demand, and Government Policies • In a free, unregulated market system, market forces establish equilibrium prices and exchange quantities. • Prices in mixed systems are not necessarily a response to market demand and supply • Sometimes the government sets a minimum or a maximum price for certain goods.
CONTROLS ON PRICES • Are usually enacted when policymakers believe the market price is unfair to buyers or sellers. • Examples: price ceilings and floors.
Are Price controls Effective? • Can government control of prices improve the market outcome? • In principle, there are two lessons to be learn: • The market reacts to the government’s policies which in many cases weakens the effect of the policy • Unexpected and negative consequences result from government intervention
CONTROLS ON PRICES • Price Ceiling • A legal maximum on the price at which a good can be sold. • Set by the government to • limit inflation or to • Keep prices of selective goods affordable for low income individuals • Used in many cities to keep housing costs down • In 1970 more than 200 US cities enacted some form of rent control
CONTROLS ON PRICES • Price Floor • A legal minimum on the price at which a good can be sold. • Typically used to benefit the sellers of a certain good • The 1938 Fair Labor Standards Act established the first federal minimum wage laws • Minimum wage laws were widely supported as a means to maintaining the minimum standards of living
Rent Control • Rent controls are ceilings placed on the rents that landlords may charge their tenants. • The goal of rent control policy is to help the poor by making housing more affordable. • One economist called rent control “the best way to destroy a city, other than bombing.”
Demand Demand for Housing • The demand curve shows the total number of housing units demanded at each price • Demand is downward sloping • As the rental price increases, households substitute away from housing by • Sharing housing units with others • Consuming smaller housing units • Housing demand is inelastic in the short run Rent Quantity 0
Supply Supply for Housing • The supply curve shows the total number of housing units supplied at each price • Supply is upward sloping • As the rental price increases, more housing units will be available through • Construction of new units (long run) • Conversion from other uses (short run) • Housing supply is inelastic in the short run Rent Quantity 0
S1 S2 D1 D2 Equilibrium • An increase in demand results in a higher rental price and an increase in quantity supplied of rental apartments • In the long run, new housing units are constructed as investment in housing becomes more profitable and the supply shifts right Rent Quantity 0
Rent Control • Rent control was enacted before WWII, as policy makers were worried about inflation. • After WWII, several American cities kept rent control regulations in place to keep housing affordable for low income groups • What are the actual effects?
Supply $500 400 Rent Control Shortage Demand 9 11 Quantity Quantity supplied demanded Effect of Rent Control Rent • A shortage results, which grows with increasing demand • People are forced to delay the decision to move out of rent controlled units or to add to their living space. Quantity 0
Supply $500 400 Rent Control Shortage Demand 9 11 Quantity Quantity supplied demanded Effect of Rent Control Rent • Rent is not low for everyone • Since a rent higher than $400 is illegal, the market cannot work to allocate the housing units among people. • Illegal payments to landlords • Rent is higher in non rent controlled areas Quantity 0
Effect of Rent Control • No incentives to construct new housing units as it becomes less profitable • Housing supply shrinks in the long run as some home builders exit the market • Fewer rent controlled housing units which contributes to homelessness
Effect of Rent Control • Housing quality deteriorates as landlords have less incentives to maintain them • Resource misallocation occurs as goods of value are underprovided since the price is not allowed to reflect housing value.
Minimum Wage • Setting a minimum hourly wage is seen as a way to preserve a certain level of income for those at the end of the income scale • Questions: • Who benefits? • Effects on the labor market? on poverty? • Objective: Understand how wage is determined in a free market
Labor demand Labor Demand • Demand for labor is downward sloping • Demand for labor is a derived demand Wage Quantity of Labor
Deriving Labor Demand • When an additional worker is hired, production increases and thus the total revenue of the firm increases • This increase in revenue is called the marginal revenue product, which is the marginal benefit of hiring that worker
Deriving Labor Demand • As additional workers are hired output increases at a decreasing rate • The additional output, i.e., Marginal Product, eventually declines • This is referred to as the law of Diminishing Marginal Product • Assume price= $0.5 - 5 20 25 20 10 5 1 - 2.5 10 12.5 10 5 2.5 0.5
Deriving Labor Demand • The cost of hiring an extra worker is the wage, W • The extra worker will be hired if the marginal benefit exceeds (or equals) the marginal cost of hiring him. • The extra worker will be hired if: MRP >=W
Labor Demand • If W=2.5, How many workers will be hired? • If W=5, How many workers will be hired? • The labor demand curve is the downward sloping part of the MRP curve MRP 5 Labor Demand 2.5 1 5 6 Quantity of Labor
Labor Supply • What will happen to the number of hours worked as the wage rate increases? • Time allocate between work and leisure • Substitution effect: work more consume less leisure • Income effect: higher income leads to consuming more leisure and working less General Conclusion: Labor supply is upward sloping
Labor Supply Labor surplus (unemployment) Minimum wage Equilibrium wage Labor demand Quantity demanded Quantity supplied How the Minimum Wage Affects the Labor Market Wage 0 Quantity of Labor
How the Minimum Wage Affects the Labor Market • The minimum wage results in an increase in the quantity supplied of workers and a decline in the quantity demanded. • Unemployment results as workers who are willing to work at the min wage are more than the jobs offered
Who gets to work at the minimum wage? • The answer will determine the distributional impact of the policy • Research suggests that employers when faced with a larger labor pool under the minimum wage law, can discriminate between workers. • Teenagers tend to be discriminated against due to their limited training and education relative to others in the pool • Similarly for women and minorities.
TAXES • Governments levy taxes to : • raise revenue for public projects • Change market price to reduce trade in a particular good
How Taxes Affect Market Outcomes • Tax incidence • Tax incidence is the manner in which the burden of a tax is shared among participants in a market. • Tax incidence is the study of who bears the burden of a tax. • Taxes result in a change in market equilibrium.
How Taxes Affect Market Outcomes • When a tax is imposed there are two prices of interest: • The price that the buyers pay, . • The price that sellers receive, . • The difference between the two is the tax, t. • Let’s first consider a tax on sellers.
A tax on sellers Price sellers accept under the tax S2 shifts the supply curve upward by the amount of S1 the tax ($0.50). Tax ($0.50) 3.00 0.80 Price Sellers accept before the tax Demand, D1 100 A Tax on Sellers Price 1.30 Quantity of 0 30 Ice-Cream Cones
S2 S1 $3.30 Tax ($0.50) 3.00 Price 2.80 Before tax Demand, D1 90 100 A Tax on Sellers Price of Ice-Cream Cone Quantity of 0 Ice-Cream Cones
A tax on the buyer vs. a tax on the seller? • A $t tax imposed on the buyer has the same effect as a $t tax imposed on the sellers • The price received by the seller is the same. • The price paid by the buyer is the same. • The tax creates a wedge between the supply and demand curves. • The burden of the tax is shared between buyers and sellers.
S Price buyers pay ($3.3) Tax wedge ($0.5) Price without tax Price sellers Receive ($2.8) D Effects of a tax • Losers: both buyers and sellers, regardless of who the tax is imposed on • Winners: government revenue • The tax results in a reduction in quantity Price Qt Quantity 0