Download
1 / 33
340 likes | 503 Views
EPA’s Response to Fukushima Japan Nuclear Emergency. Jen Mosser Center for Radiological Emergency Management Office of Radiation & Indoor Air August 16, 2011. Outline. An introduction to EPA’s Office of Radiation and Indoor Air (ORIA) Who we are Our role in radiological emergency response

E N D
EPA’s Response to Fukushima Japan Nuclear Emergency Jen Mosser Center for Radiological Emergency Management Office of Radiation & Indoor Air August 16, 2011
Outline • An introduction to EPA’s Office of Radiation and Indoor Air (ORIA) • Who we are • Our role in radiological emergency response • EPA’s response to the Fukushima Japan nuclear incident • RadNet monitoring program • What we found
EPA’s Radiation Emergency Response Program • Personnel from ORIA and our regional radiation counterparts contribute to radiation emergency response by providing: • Leadership of U.S. domestic response to foreign incidents, support for responses under Nuclear/Radiological Incident Annex of National Response Framework • Support to OSCs and Special Teams under National Oil and Hazardous Substances Pollution Contingency Plan (NCP) • Advice to the EPA Emergency Coordinator (OSWER/OEM) on radiation
ORIA Homeland Security/Radiological Emergency Response Program • Center for Radiological Emergency Management • Nuclear Incident Response Team • Protective Action Guides (PAGs) • MARSSIM, MARSAME, MARLAP • EPA-RERP • Radiological Emergency Response Team (RERT) • Technical advice and assistance related to: prevention; containment; cleanup; and recovery from a radiological incident • Provide advice on protective measures • Perform assessments of dose and impact of any release • Conduct monitoring, sampling, laboratory analyses and data assessments to assess and characterize environmental impacts • Regional Support Roles • Regional RERT Liaison - Coordinates between the regional radiation program and the RERT • Regional Radiation Advisor - Provides radiological technical advice to the regional OSC, management, and personnel
RERT • Provide guidance and on-scene assistance at Superfund and ER sites to OSCs and in the Federal Radiological Monitoring and Assessment Center (FRMAC) • Field-deployable RERT • Focus is on identifying and assessing potential impacts of low-level contamination • Field monitoring instruments and sample collection equipment • Mobile laboratories and capabilities • Two “fixed” laboratories capable of providing comprehensive environmental analytical services
2011 EPA-RERP Scenario 1 • Impacts one or more sites within U.S. • OSWER is EPA’s response lead • OSC serves as Incident Commander • Special Teams support response • RERT Commander serves as Senior EPA Representative in the FRMAC if established Example: Las Conchas Fire Response (2011)
2011 EPA-RERP Scenario 2 • Does not create a specific site within U.S. • ORIA is EPA’s response lead • Limited field activities expected (no Incident Commander) • ORIA conducts sampling, RadNet deployment Example: Japan Foreign Nuclear Incident (2011)
EPA’s Response to the Fukushima Daiichi NPP Emergency • Review the Incident – What Happened • Describe the EPA Response • Review EPA’s RadNet Monitoring Program • Present Illustrative Monitoring Results • Discuss results, potential impacts and risks from the Fukushima in US
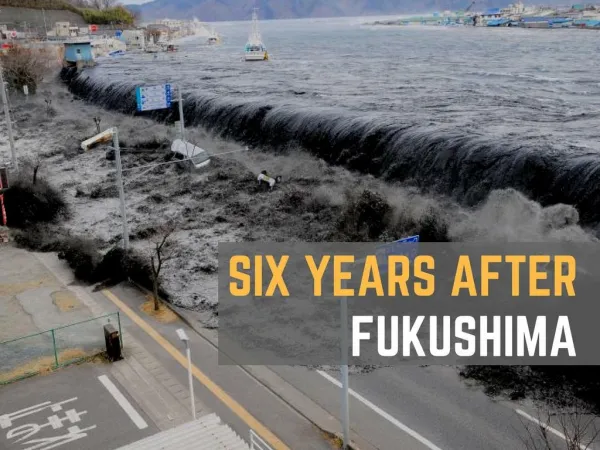
Natural Disaster Triggers Fukushima Daiichi Nuclear Disaster Friday, March 11, 2011 • 9.0 Earthquake – 2:46 pm • Automatic shutdown / Control rods lowered • 14 Meter Tsunami– 3:42 pm • Loss of power, incl. backup • Sea water pumps disabled http://www.nytimes.com/interactive/2011/03/11/world/asia/ maps-of-earthquake-and-tsunami-damage-in-japan.html
Impact of Earthquake and Tsunami Damage to the Reactors • Level 7 - "Major Accident" on International Nuclear Event Scale • "A major release of radioactive material with widespread health and environmental effects requiring implementation of planned and extended countermeasures" • Loss of cooling • Damage to secondary containment vessels • Fuel meltdown Releases of Radiation to the Environment • “More than several tens of thousands of terabequerels of I-131” • Air releases – intentional venting and hydrogen explosions • Ocean Releases – intentional release of cooling water and leakage http://www.dae.gov.in/daiichi/japan130411.pdf
Impact of Earthquake and Tsunami NOAA Projection of Plume Deposition 3/22-3/25/2011
EPA Response Activities • HQ EOC Activation – March 15 • Advisory Team for Environment, Food and Health • Science Tiger Team set up for technical issues • Public Information • Environmental Unit • Radnet Increased Operations • Deployable air monitors set up in Regions 9 and 10 • Additional milk & drinking water samples late March & April; increased analysis of precipitation samples • National Air and Radiation Environmental Laboratory (NAREL ) • 24/7 Operation to count samples • Increased attention to “near-real time” RadNet data • EPA Japan Incident Website http://www.epa.gov/japan2011/
Coordination with States & Political Leaders • Data posting notifications to HHS, FDA, CDC and CRCPD • Twice weekly calls with ASTHO, NCCHO, and ECOS • ESF-8 conference calls • EPA Senior Leadership worked with Governors, Congress • California example : CalEPA formed MAC on March 22 • Management / Policy level with reps from USEPA RIX, CDPH, Cal/EPA, CDFA, CalEMA, CCLHO, CCDEH and CAPCOA • Technical group with RHB and USEPA to evaluate state and fed data • MAC met 3 times and learned it should form earlier
National Radiation Monitoring System • EPA's RadNet monitors across the US show typical fluctuations in background radiation levels • Deployable monitors were sent to Alaska, Hawaii, Idaho, Guam and Saipan to improve monitoring coverage (add’l units staged in Region 10 warehouses) • The levels detected are far below levels of concern
RadNet Deployable Monitors:Fukushima Response Nome Juneau Nome Saipan Guam
Setting up monitors in Guam RadNet Deployable Monitors: Juneau Inside of a deployable Nome Working in the rain in Buffalo Detector Assembly
RadNet Monitoring Returned to normal RadNetoperatioins in May
Samples Collected during Japan FNI • Fixed Monitors • 1,600 filters collected • 151,000 data sets received in near-real time • Deployables • 350 charcoal cartridges collected • 335 2-inch filters and 335 4-inch filters collected • 31,000 data sets received in near-real time • Precipitation • 32 cities sampled, 170 samples collected • Drinking Water • 71 cities sampled, 154 samples collected • Milk • 36 cities sampled, 67 samples collected Samples collected from March 11 to May 5, 2011
Monitoring Results • Why focus on Iodine-131? • Primary Component of Fukushima release • Gaseous Phase • Transported great distance in atmosphere • Sensitivity • Easily detected and measured • Clearly Illustrates impacts and trends • Primary Source of Potential Exposure
Iodine-131 Air Cartridge Results Maximum Concentration: 2.8 pCi/m3, Dutch Harbor, 20 March 2011
Iodine-131 in Precipitation EPA’s Drinking Water Maximum Contaminant Level (MCL )for Iodine-131 is 3 pCi/L. This Drinking Water MCL is based on long-term chronic exposures over a 70 year lifetime. Maximum Concentration: 390 pCi/L, Boise, 27 March 2011 http://www.epa.gov/japan2011/rert/radnet-sampling-data.html
Iodine-131 in Drinking Water • Drinking Water levels • Dependent upon precipitation to surface • On Surface, impacted by dilution, transport times, decay • All “hits” in line with historical results for Drinking Water analyses • No Sample exceeded the Drinking Water MCL (3.0 pCi/L) http://www.epa.gov/japan2011/rert/radnet-sampling-data.html
Iodine-131 in Milk FDA's Derived Intervention Level (DIL) for Iodine-131 in milk is 4,770 pCi/L Maximum Concentration: 18 pCi/L, Hilo, 4 April 2011 http://www.epa.gov/japan2011/rert/radnet-sampling-data.html
Science Team – Advisory Team Interactions • Sea Water • Intentional release of contaminated water used for cooling* • Leakage from damaged reactor Iodine-131: 3 May - below drinking water MCL 30km offshore of Fukushima 4 June - Not Detectable at Japanese offshore sampling locations • Modeling indicates greater potential impact to US coastal areas from precipitation than from transport • Seafood • No levels above MDC seen in migratory fish species; Migratory patterns of North American Pacific Salmon most commonly do not reach the coastal or offshore waters of Japan; The majority of Alaska Salmon spend most of their ocean residence in the Gulf of Alaska • Japanese sand lance is only fish that exceeded radiation standards - does not migrate • FDA Monitoring seafood shipments to US • Cargo Screening • Analyze DOT regulations and applicable CBP detection methods • Revisiting the 50-mile evacuation zone for US Citizens in Japan * to make space for more highly-contaminated water
Putting Fukushima Risk in Perspective Average annual radiation dose per person in the U.S. is 620 mrem Calculate your estimated annual radiation dose: http://www.epa.gov/radiation/understand/calculate.html
What is Additional Risk from Fukushima? • Trace levels of radioactive isotopes measured are consistent with the Japanese nuclear incident and far below levels of public health concern. • Additional exposure from well below 1 mrem for individuals in US and Territories • Measured levels hundreds to thousands of times lower than FDA Derived Intervention Levels (DILs) • Greater risk from Radon - 212 mrem/yr NCRP 160, 2009 http://www.epa.gov/radiation/understand/perspective.html
What Went Well • Overall RadNet program and technology • Near real time RadNet data • Detection limits extremely low • Reasonable turnaround on lab sample data • Unprecedented web attention • State/local voluntary support of RadNet
What Can Be Improved • Communication Communication Communication! • Better procedures for radiation emergency incidents • Timely data transfer to regions, states, local agencies, tribes • Better data interpretation & messaging to public & press • Quicker coordination with NOAA and DOE to get plume trajectory model info EPA’s Radiation Protection Division is collecting observations, lessons, and improvement ideas – will share
Ongoing EPA Commitment “While we do not expect radiation from the damaged Japanese reactors to reach the United States at harmful levels, I want to assure you that EPA will continue our coordination with our federal partners to monitor the air, milk, precipitation and drinking water for any changes, and we will continue our outreach to the public and the elected officials to provide information on our monitoring results.” – Administrator Lisa P. Jackson For more information and updates… Calculate your estimated annual radiation dose: http://www.epa.gov/radiation/understand/calculate.html FAQs on Japan Nuclear Emergency www.epa.gov/japan2011/japan-faqs.html Summary of monitoring results www.epa.gov/japan2011/rert/radnet-data-map.html Summary of laboratory results www.epa.gov/japan2011/rert/radnet-sampling-data.html