Download
1 / 23
230 likes | 342 Views
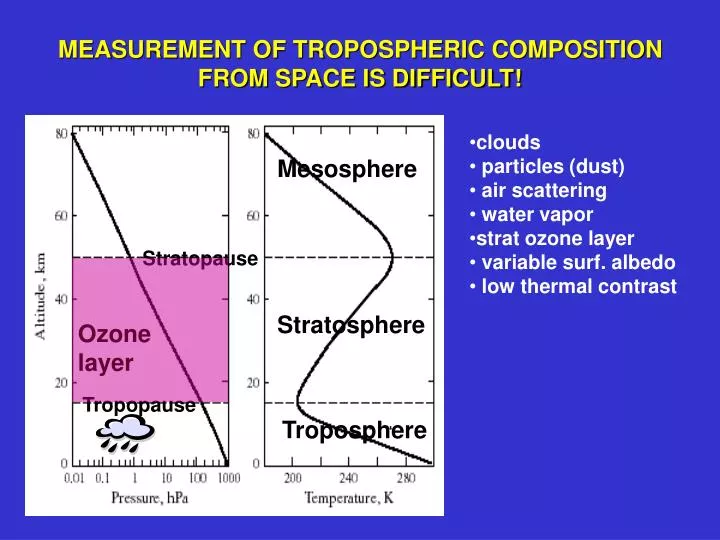
Stratopause. Tropopause. MEASUREMENT OF TROPOSPHERIC COMPOSITION FROM SPACE IS DIFFICULT!. clouds particles (dust) air scattering water vapor strat ozone layer variable surf. albedo low thermal contrast. Mesosphere. Stratosphere. Ozone layer. Troposphere.

E N D
Stratopause Tropopause MEASUREMENT OF TROPOSPHERIC COMPOSITION FROM SPACE IS DIFFICULT! • clouds • particles (dust) • air scattering • water vapor • strat ozone layer • variable surf. albedo • low thermal contrast Mesosphere Stratosphere Ozone layer Troposphere
PRESENT AND SCHEDULED SATELLITE INSTRUMENTS FOR TROPOSPHERIC CHEMISTRY 2002 2002 2004 2004 2004 2004 2004
SOLAR BACKSCATTER OBSERVATIONS FROM SPACE(TOMS, GOME, SCIAMACHY, OMI, OCO) absorption Backscattered intensity IB l1 l2 wavelength Slant optical depth “Slant column” Scattering by Earth surface and by atmosphere EARTH SURFACE
AIR MASS FACTOR (AMF) CONVERTS SLANT COLUMN WS TO VERTICAL COLUMN W “Geometric AMF” (AMFG) for non-scattering atmosphere: q EARTH SURFACE
IN SCATTERING ATMOSPHERE, AMF DEPENDS ON VERTICAL DISTRIBUTION OF COLUMN Illustrative retrieval of HCHO column at 340 nm “Sigma” vertical coordinate = normalized pressure Instrument sensitivity w(s) (“scattering weight”) what GOME sees Vertical shape factor S(s) (normalized mixing ratio) AMFG = 2.08 actual AMF = 0.71 Palmer et al. [2001]
USE GLOBAL 3-D MODEL DRIVEN BY ASSIMILATED METEOROLOGICAL DATA TO PROVIDE AMFs FOR EVERY SATELLITE VIEWING SCENE GEOS-CHEM MODEL LIDORT RAD.TRANSFER MODEL AMF spectral fit SATELLITE DATA SLANT COLUMN VERTICAL COLUMN • Best information applied to each scene • Consistency in comparing model and observed columns • Apply with any 3-D model (recalculate AMFs using tabulated scattering weights) ADVANTAGES OF 3-D MODEL APPROACH FOR COMPUTING AMFs
THE GOME SATELLITE INSTRUMENT • Nadir-viewing solar backscatter instrument (237-794 nm) • Low-elevation polar sun-synchronous orbit, 10:30 a.m. observation time • Field of view 320x40 km2, three cross-track scenes • Complete global coverage in 3 days • Operational since 1995 APPLY HERE TO MAPPING OF HCHO AND NO2 TROPOSPHERIC COLUMNS
USE GOME MEASUREMENTS OF NO2 AND HCHO COLUMNSTO MAP NOxAND VOC EMISSIONS GOME Tropospheric NO2 column ~ ENOx Tropospheric HCHO column ~ EVOC ~ 2 km hn (420 nm) BOUNDARY LAYER hn (340 nm) NO2 NO HCHO CO OH hours O3, RO2 hours VOC 1 day HNO3 Emission Deposition Emission NITROGEN OXIDES (NOx) VOLATILE ORGANIC CARBON (VOC)
GOME HCHO SLANT COLUMNS (JULY 1996) T. Kurosu, P.I. Palmer T. Kurosu (SAO) and P. Palmer (Harvard) Hot spots reflect high VOC emissions from fires and biosphere
HCHO COLUMNS FROM GOME OVER U.S.:July 1996 means Palmer et al. [2001] BIOGENIC ISOPRENE IS THE MAIN SOURCE OF HCHO IN U.S. IN SUMMER GEIA isoprene emissions R = 0.83 Bias 14% Precision: 4x1015 cm-2
STRATEGY FOR GOME VALIDATION: USE 3-D MODEL AS INTERMEDIARY GOME OBSERVATIONS • IN SITU OBSERVATIONS • Aircraft • Ground-based Compare Compare GEOS-CHEM model
Observations Model MODEL vs. OBSERVED HCHO VERTICAL PROFILES OVER U.S. AND N. ATLANTIC Aircraft observations from Y.-N. Lee (SOS) and A. Fried (NARE) SOS (southeast U.S., Jul 1995) NARE (N. Atlantic, Sept 1997) Palmer et al. [2001]
MODEL vs. OBSERVED SURFACE HCHO Mean daytime HCHO surface observations Jun-Aug 1988-1998 Model (1996) vs. observations Palmer et al. [2002]
SLANT COLUMNS OF HCHO FROM GOMEHigh values over southeast U.S. are due to biogenic isoprene emission Note “isoprene volcano” over the Ozarks Palmer et al. [2002]
DEPENDENCE OF GOME HCHO COLUMNSOVER THE OZARKS ON SURFACE AIR TEMPERATURE Temperature dependence of isoprene emission (GEIA) Palmer et al. [2002]
Displacement/smearing length scale 10-100 km hours hours HCHO hn, OH OH isoprene USING GOME HCHO COLUMNS TO MAP ISOPRENE EMISSIONS Get EISOPvs. WHCHOrelationship from GEOS-CHEM
GEOS-CHEM RELATIONSHIP BETWEEN HCHO COLUMNS AND ISOPRENE EMISSIONS IN N AMERICAUse relationship to map isoprene emissions from GOME observations NW NE GEOS-CHEM July 1996 Model HCHO column [1016 molec cm-2] SW SE model without isoprene Palmer et al. [2002] Isoprene emission [1013 atomC cm-2 s-1]
MAPPING OF ISOPRENE EMISSIONS FOR JULY 1996 BY SCALING OF GOME FORMALDEHYDE COLUMNS [Palmer et al., 2002] GOME COMPARE TO… GEIA (IGAC inventory) BEIS2 (official EPA inventory)
SLANT COLUMNS OF NO2 FROM GOMEDominant stratospheric contribution (NO2 produced from N2O oxidation)Also see tropospheric hot spots (fossil fuel and biomass burning) Remove stratospheric column and instrument artifacts using data over Pacific Martin et al. [2002a]
SLANT COLUMNS OF TROPOSPHERIC NO2 FROM GOME 1996 Martin et al. [2002]
GOME SPECTRUM (423-451 nm) SLANT NO2 COLUMN TROPOSPHERIC SLANT NO2 COLUMN TROPOSPHERIC NO2 COLUMN PROPAGATION OF ERRORS IN NO2 RETRIEVAL(errors e in 1015 molecules cm-2) Fit spectrum e1 = 0.8 • Use Central Pacific GOME data with: • HALOE to test strat zonal invariance • PEM-Tropics, GEOS-CHEM 3-D model to treat tropospheric residual Remove stratospheric contribution, diffuser plate artifact e2 = 0.4 • Use radiative transfer model with: • local vertical shape factors from GEOS-CHEM • local cloud information from CRAG Apply AMF to convert slant column to vertical column e3 = 0.5-3.2 Martin et al. [2002a]
GOME RETRIEVAL OF TROPOSPHERIC NO2vs. GEOS-CHEM SIMULATION (July 1996) Martin et al. [2002a] GEIA emissions scaled to 1996
CAN WE USE GOME TO ESTIMATE NOx EMISSIONS?TEST IN U.S. WHERE GOOD A PRIORI EXISTS Comparison of GOME retrieval (July 1996) to GEOS-CHEM model fields using EPA emission inventory for NOx GOME GEOS-CHEM (EPA emissions) BIAS = +3% R = 0.79 R = 0.78 Bias = +18% Martin et al. [2002a]