Download
1 / 13
130 likes | 391 Views
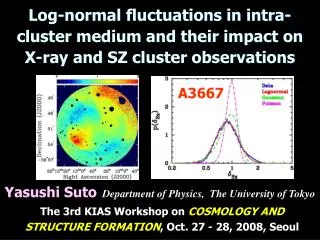
Longitudinally-dependent ozone recovery in the Antarctic polar vortex revealed by satellite-onboard ILAS-II observation in 2003. Kaoru Sato Department of Earth and Planetary Science The University of Tokyo, Tokyo, Japan *Y oshihiro Tomikawa National Institute of Polar Research, Tokyo, Japan

E N D
Longitudinally-dependent ozone recovery in the Antarctic polar vortex revealed by satellite-onboard ILAS-II observation in 2003 Kaoru SatoDepartment of Earth and Planetary Science The University of Tokyo, Tokyo, Japan *Yoshihiro TomikawaNational Institute of Polar Research, Tokyo, Japan H. Nakajima, and T. SugitaNational Institute for Environmental Studies, Ibaraki, Japan
Stratospheric transport and mixing processes related to the ozone recovery Holton et al. (Rev. Geophys, 1995) • Purposes of this study to examine • What is three dimensional structure of the ozone recovery? • Is the B-D circulation only the process contributing ozone recovery before the polar vortex breaking?
Antarctic ozone hole and its observations in 2003 The Antarctic ozone hole in 2003 was developed into large (3rd after 2000 and 2006) and showed a similar life cycle to that in 2000. Ozonesonde observations at Syowa Station O3 data from 97 ECC ozonesondes for11 June 2003 – 9 January 2004 ILAS-II (Improved Limb Atmospheric Spectrometer-II) observations O3 and long-lived tracers (N2O and CH4) in the stratosphere at 14 longitudes a day for 15 June –25 October 2003.
Time variation of O3 partial pressure Vertical profiles of O3 partial pressure at Syowa Station (69S, 39.6E) (left) from late June to early October and (right) from early October to early December.
Seasonal variation of the polar vortex in the Antarctic in 2003 Tangential wind speeds along the potential vorticity contours at 500K (colors). Contours show the potential vorticity (PVU).
Seasonal variation of O3 mixing ratio at Syowa Station 1.1±0.2 km/mon Time-height section of O3 mixing ratio from ozonesonde observationsat Syowa Station (69S, 39.6E). Thick dashed curves show the -80oC isotherms roughly indicating possible PSC areas.
Seasonal variation of O3 mixing ratio as a function of longitudeobserved by ILAS-II • The downward movement of the contour in late September through late October is clear in any longitude region. • An interesting feature is that the downward speed is largely dependent on longitude. Time-height sections of O3mixing ratio (colors) inside the polar vortex for six longitude regions based on the ILAS-II observations. Contours show isentropic surfaces.
X: CH4 ●: O3 ▲: N2O Descent rates (km/mon) as a function of longitude Descent rates around z=20km estimated using ILAS-II observations. Right marks show the zonal means.
Dynamical fields in 25 Sep.-24 Oct., 2003 Schematic view of longitudinally-dependent descent rate. Black lines represent isentropes. Red arrows show descent rates. Maps of (a) the time mean geopotential height and (b) its anomaly from the zonal mean at 50 hPa (z~20km). Time series of (c) GPH amplitude and (d) temperature as a function of longitude.
X: CH4 ●: O3 ▲: N2O Descent rates (K/mon) as a function of longitude Decent rates around relative to the isentrope estimated from ILAS-II observations.
Backward trajectory analysis Backward trajectories starting at (a) 0-60oE and (b) 180-240oE shown by blue shades. A map of total ozone averaged for 26 Sep. to 24 Oct. 2003.
Time variation of scatter diagrams of O3 and N2O mixing line ozone vortex outside vortex inside N2O Scatter diagrams of O3 and N2O mixing ratios for every ten days. Different colors show results at different isentropic levels.
Conclusions • Three dimensional nature of the ozone recovery processes in the Antarctic spring was examined based on ozonesonde and satellite observations. • The ozone recovery was largely dependent on longitude in isentropic coordinates even before the polar vortex breaking. • This feature is explained by trajectories of air parcels which are largely modified by dominant quasi-stationary planetary waves. • Strong mixing with ozone rich air at the polar vortex edge seems to occur for air parcels observed in particular longitude regions.