Download
1 / 23
230 likes | 358 Views
Enlargement, Migration and Policy Co-ordination. Tito Boeri (Bocconi University and Fondazione RODOLFO DEBENEDETTI). Labour and Capital Flows in Europe Following Enlargement IMF-JVI-NBP Conference 30-31 January 2006, Warsaw. Outline.

E N D
Enlargement, Migration and Policy Co-ordination Tito Boeri (Bocconi University and Fondazione RODOLFO DEBENEDETTI) Labour and Capital Flows in Europe Following Enlargement IMF-JVI-NBP Conference 30-31 January 2006, Warsaw
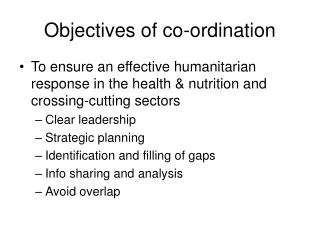
Outline • Why a race-to-the top in migration restrictions before May 1st 2004? A policy co-ordination dilemma? • Why are Europeans getting so tough on migrants? • Which migration policy for the European Union?
Key findings/messages • Migration flows from NMS are being diverted by asymmetric transitional arrangements in the EU 15, reducing aggregate benefits from Enlargement • Migration to “imperfect” labour markets is more costly for natives than migration to flexible markets in the short-run • A point system may ease co-ordination of migration policies at the EU level.
The “race to the top” From free mobility to transitional arrangements restricting access to: • labour market inAustria,Belgium, Denmark, Finland, France, Germany, Italy, Greece, Luxembourg, the Netherlands, Portugal and Spain • welfare in Ireland and UK • Only in Sweden free mobility
Effects of the race-to-the-top • UK.counterfactual: 12,000 (net inflow); recorded flows: May through Dec 04: 130,000 migrants from NMS. Excluding those applying before May and temporary migrants, still more than 50,000. • Ireland.counterfactual: 3,100 (net inflow); recorded flows: 31,000 permits for workers from NMS in the May-October 04 period. • Sweden. counterfactual: 6,200 (net inflow); recorded flows 3,966 work permits (up from 2,097 in 2003) • Denmark. counterfactual: 2,900 (net inflow); recorded flows: 2,048 work permits in 2004 • Italy. counterfactual: 30,000 (net inflow); recorded flows : 15,000 in 2004-5
Less migration and diverted Altogether, preliminary evidence suggests that(i) total migration into the EU-15 is at around 100-150,000 persons in 2004, roughly one-third of the projected migration potential, and (ii) substantial migration diversion away from main receiving countries towards those which have been less restrictive (and English-speaking)
Why racing to the top? • Short-term aggregate costs of migration to “rigid countries” • Highlighted by calibrating to Eastern Enlargement a model of migration between economies with European institutions: • Collective bargaining and minimum wages • Barriers to regional mobility • Welfare (unemployment) benefits
With rigid LS With elastic LS Immigration to flexible labour markets w w Ls Ls w0 w0 w1 w1 Ld Ld N N+M L L N’ N N’+M
Immigration to imperfect labour markets • With a minimum wage • With semi-rigid wages w w Ls Ls w0 w w1 Ld Ld L L N N Unemp Unemp
Regional diff Homogeneous regions change in % at migration of 1 % 1. GDP • total region: 0.51 0.26 • West: 0.90 0.57 • East: - 0.55 - 0.55 2. Native income • total region: 0.04 - 0.04 • West: 0.003 - 0.12 • East: 0.16 0.16 3. Migrant income 242.5 167.6 Accounting for “greasing the wheels” effects
Summary of simulation results • Large total gains from migration: +0.2 to +0.5% GDP with migration of 1% • Most gains accrue however to migrants and their employers • Losses for manual labour (-0.2% to -0.55%) and non-manual labour (-0.1% to -0.5%) in receiving countries • Stronger conflict of interest migrants-natives in presence of generous welfare systems and unskilled migration
The co-ordination dilemma • Public opinion is more against migrants in countries with “rigidities” and generous welfare • Institutional asymmetries make it more difficult to co-ordinate inducing tighter and tighter migration policies in rigid countries
Looking ahead: policies vis-à-vis third countries Two options: • Closing the welfare door to migrants? 2. Increasing the skill content of migration via a point system
Closing the welfare door? • Popular policy. It would address concerns of public opinion. • It would affect the size of migration flows (increase by 1 stdev of generosity implies 3% higher migration) more than their skill composition • Difficult to enforce: experience of California • Problems in the assimilation of migrants • Equity considerations
A point system? • Skilled migration is better for rigid countries • Simplification of policies (including asylum) • Is it effective in selecting migrants? • Risk of “brain drain”? • Equity considerations.
Evidence on brain drain effects on LDC growth Source: Docquier – Rappoport (2004)
Skill distribution of migrants ad natives (IALS scores) Germany New Zealand
Migration policies are already getting selective • Everywhere tightening of migration policies towards the unskilled • While race to attract highly skilled migrants • Explicit point systems in an increasing number of countries (Canada since 67, Australia since 84, New Zealand since 91, Switzerland since 96)