Download
1 / 67
740 likes | 1.06k Views
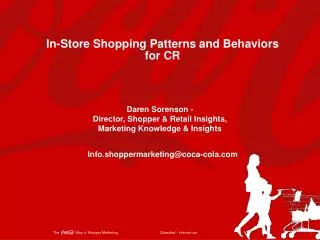
In-Store Shopping Patterns and Behaviors for Supers. Daren Sorenson - Director , Shopper & Retail Insights, Marketing Knowledge & Insights. Info.shoppermarketing@coca-cola.com. Introduction & Supermarket/Supercenter Insights. January 30, 2006.

E N D
In-Store Shopping Patterns and Behaviors for Supers Daren Sorenson - Director, Shopper & Retail Insights, Marketing Knowledge & Insights Info.shoppermarketing@coca-cola.com
Introduction & Supermarket/Supercenter Insights January 30, 2006 Strictly Confidential: For Internal Use Only
The Case for Change • Retailers value and expect shopper information: “Consumer information today is the least leveraged and most important information vendors can provide to us. Those that know how to use it, tie-in with an entire program that shows us what items to take, how to arrange them on the shelf and how to merchandise for maximum impact.”-- from Cannondale survey • Strategic understanding of a retailer’s overall business, not just beverages, is necessary to get a seat at the table today Target roundtable spurred the Landmark study • The importance of shopper insights / marketing is recognized throughout the system. Top priority for: • CCNA Retail • CCE • Global Customer Management and Global Commercial Leadership Team
Supermarkets are Battling Competitive Threats from All Sides Sales are Migrating to Other Channels: • Center Store Category sales to Mass, Club and Dollar Channel • Perimeter Category sales to Specialty Supermarkets Source: *IRI Panel Data
Several Suppliers are Developing Strategic Shopper Insights Capabilities Kraft Suppliers that can bring the best insights and shopper-inspired programs will be well-positioned to partner with retailers in the future General Mills Unilever
Five-Year Vision: Know more about the retail shopper… who they are, their needs, behaviors, and purchase triggers …and do this better than anyone else …in a way that creates value for our customers and drives topline growth Scope: Through the Eyes of the Shopper Focus on the “consumer as shopper” …shoppers in outlet and “near” outlet CCNA Shopper Marketing Vision Strategies: Capture the InsightsDevelop in-depth understanding of shoppers from attitudinal & behavioral perspective Build the CapabilityDevelop capabilities and processes to identify and apply Shopper Insights Activate the InsightsGuide the system in creating effective in-store marketing based on shopper insights Enhance the ScienceExplore new techniques to understand shoppers across channels and occasions
The Journey has Begun • 2007 • Deepen knowledge & capability • Access insights on demand • Ground in-store programs in insights • Benefit from customer acknowledgement of expertise • 2006 • Build the capability • Create foundational insights (Landmark) • Begin the dialog: • Internally • With our customers • 2005 • Recognize the importance • Start the learning: • “The World According to Shoppers” • RFID studies • Prioritization and focus is required to build our system’s capability in shopper insights and marketing • Insights without activation are worth nothing
Today’s Destination Today’s presentation will cover a number of key questions: • Why are shopper insights so critical to our business and that of our customers? • What are some of the consumer issues that are impacting how people shop? • How do grocery and convenience retail shoppers behave in the retail environment? • How can we begin to better align our in-store marketing and merchandising with shoppers? • What is Coca-Cola planning in 2006 to become the industry’s leader in shopper insights?
Outline • Trends & Pressures Affecting Consumers & Shoppers • Supermarket & Supercenter Shopper Behavior: 2005 RFID Study Highlights • Turning Insights into Action
The World According to Shoppers Highlighted How Consumer Pressures Drive Shopper Need States As consumers grow more time-starved, we are seeing changes in their preferences and behaviors Source: The World According to Shoppers, 2004
Time Pressures are Influencing Where and How Consumers Shop As consumers’ lives grow more hectic, shopping is becoming less enjoyable Retailers that excel in shopability will have an advantage over rivals in attracting and maintaining loyal shoppers Source: 2004 Yankelovich MONITOR I (The General Lifestyle Study)
Shopability has Become a Critical Point of Differentiation for Retailers What is shopability? Anything that enables the shopper to make a faster, easier, better decision • Improving shopability will impact a variety of things we traditionally work with the customer on (e.g. Signage, promotional space, POP displays) • This cannot be the responsibility of sales/customer marketing alone…suppliers that guide the shopper best will win shelf space, promotional opportunities and co-marketing airtime Source: Bryan Gildenberg, Management Ventures, Inc. 2005
Consumers are Placing a Premium on Shopability Attributes Source: Meyers Research and MVI, August 2004
However, Retailers are Underperforming in Areas that Determine Shopability Source: Meyers Research and MVI, August 2004. Base: Respondents that shopped the retail format within the past 12 months
Shopable Stores are Better Positioned to Capture Unplanned Purchases • 60% of supermarket purchase decisions are completely unplanned • (i.e. category not in consideration set in advance of trip) Greater Potential to Drive Unplanned Purchases Higher Shopability = Source: POPAI Consumer Buying Habits Study
In-Store Marketing Enhances Shopability Percentage of shoppers that either “totally agree” or “strongly agree” with the statement Shoppers rely on in-store displays, messaging and merchandising to make their decisions and navigate the store Source: In-Store Marketing Institute, IMI International
Outline • Trends & Pressures Affecting Consumers & Shoppers • Supermarket & Supercenter Shopper Behavior: 2005 RFID Study Highlights • Supermarket Study • Supercenter Study • Turning Insights into Action
Overview of RFID Studies RFID PathTracker® Methodology Description: Radio frequency ID tags were attached to most shopping carts and baskets; receptors within store tracked in-store shopper movements during trips, with results compiled and reported Note: Demographic and socioeconomic factors were analyzed prior to selecting test stores to enhance projectability of data to Total U.S.
Key Insights & ImplicationsSupermarket PathTracker Study SUPERMARKETSTUDY Source: 2005 Supermarket PathTracker Study
The Earliest Part of the Trip Provides Exposure to the Most Shoppers SUPERMARKETSTUDY Implication: The front and first quadrant of the store offer the greatest number of shopper exposures for messaging & displays Shopper Density Map High Density Low Density • Hot Spots: Mostly on the perimeter and a few center of store aisles leading to the checkouts: produce, meat, dairy and frozen food • Dead Zones: Much of the center of store has light traffic Note: Coke and Pepsi Beverage Location Map found in Appendix Source: 2005 Supermarket RFID Study
Shoppers Shop in a Dominant, Counter-Clockwise Pattern, Shopping Aisles from Back to Front SUPERMARKETSTUDY Implication: Shoppers spend a significant amount of time in the back perimeter, shopping aisles from back to front – this makes rear endcaps and the rear-most sections of beverage aisles critical merchandising locations Traffic flow in most aisles (including CSD aisle) tends to run back to front, with shoppers buying mostly on their left. • Rear endcaps receive more shopper traffic than front encdaps • Products that are in the gondola will receive more shopper exposure if they are positioned towards the back Source: 2005 Supermarket RFID Study
Shoppers Shop at Varying Speeds During Their Trips SUPERMARKETSTUDY Implication: The speed of the shopper has serious implications for in-store messaging and merchandising; aligning the right messages and products to match the decision time of the shopper can drive overall in-store effectiveness Shoppers speed up and slow down in various parts of the store, which can impact the ability to reach them: • The beginning of the trip is generally at a slower pace, with more time investigating items • By the end of the trip, the shopper is in high speed. Getting to, and through, the checkout quickly is of high importance Walking Speed of Shoppers Fast Slow Source: 2005 Supermarket RFID Study
The First Third of the Shopping Trip: High Traffic and Slower Shop Times SUPERMARKETSTUDY Implication: The first third of the shopping trip provides a good opportunity for cross-category tie-ins, informational messaging and awareness-building Traffic Density Map High Density Low Density • Higher than average shopper traffic and longer than average decision-making times make this area particularly well-suited for: • Displaying new products; • Cross-merchandising/category tie-ins; and • Promotional messaging Note: Coke and Pepsi Beverage Location Map found in Appendix Source: 2005 Supermarket RFID Study
CSDs have High Purchase Conversion Rates in Supermarkets 95% of shoppers came within a shopable distance of CSDs during their trip (i.e. 4-6 feet) 23% of shopping trips included a CSD purchase 24% of shoppers that were within a shopable distance of CSDs actually purchased SUPERMARKETSTUDY Implication: High conversion rates for CSDs indicate that existing points of availability (primary + secondary) are effectively converting shoppers into buyers Top 4 Grocery Categories in Rank Order • With many points of availability, CSD category traffic ranks #1 (95%) • CSD conversion rates remain among the best in the store (24%), indicating that primary and secondary CSD displays are among the most productive in the store at converting shoppers into buyers Category Traffic: The % of shoppers that travel in the vicinity of the product category Purchase Incidence: The % of total shopping trips that involve a category purchase T>P Conversion Rate: The % of shoppers that travel in the vicinity of the product category and actually make a purchase 1 T>P Conversion Rate = Purchase incidence/Traffic to Points of Product Availability 2List abridged to fit on page. Source: 2005 Supermarket RFID Study
Secondary Locations are Critical to Beverage Shopability and Conversion Rates in Supermarkets SUPERMARKETSTUDY % of Shoppers that Visited Category* * % of shoppers that came within approximately 6 feet of product availability Source: 2005 Supermarket RFID Study
Aisles with High Visit Frequency and/or Longer Dwell Times Can Lead to Congestion SUPERMARKETSTUDY Source: 2005 Supermarket RFID Study
Beverage Purchase Incidence Increases with Trip Length SUPERMARKETSTUDY Purchase Incidence (All In-Store Locations) • CSD and bottled water incidence is consistently strong across trip lengths, indicating that secondary display locations are key • Isotonics and refrigerated juices are primarily purchased on longer trips but this may be due to lack of secondary availability Source: 2005 Supermarket RFID Study
Supermarket Shopper TrafficDifferences Between Quicker & Longer Trips SUPERMARKETSTUDY Quicker Trips Heavy Traffic Quicker Trips: Even more on the perimeter is a hot spot, but particularly along the front of the store and in produce. Center of store dead zones are even more prominent. Light Traffic Longer Trips Longer Trips: Hot spots are still on perimeter, more coverage in the center of the store. Much of the center of store is dead, particularly general merchandise. Source: 2005 Supermarket RFID Study
Key Insights & ImplicationsSupercenter PathTracker Study SUPERCENTER STUDY Source: 2005 Supercenter PathTracker Study
Perimeter, Transverse Aisle and Grocery Provide Exposure to the Most Shoppers and the Longest Shop Times SUPERCENTER STUDY Implication: Merchandising and messaging at key shopper interruption points will maximize shopper exposure, thereby increasing the selling opportunity Warm/hot zones have the highest concentration of shoppers Checkout CSD Location • Hot Spots: Much of the perimeter, transverse aisle and in large areas of the center of the store on the grocery side (frozen foods, snacks and CSDs). • Dead Zones: Most of the left side of the store and the general merchandise sections on the right side of the store. Density is a function of shoppers and time (10 shoppers for 1 second = 1 shopper for 10 seconds). Beverage Location Map in Appendix. Source: 2005 Supercenter PathTracker Study
Shoppers Move the Fastest on the Perimeter and Transverse Aisle SUPERCENTER STUDY Implication: Displays and call-to-action messaging on the perimeter and transverse aisle can be used to drive impulse purchases and provide reminders to shoppers Walking Speed Map Fast Higher speed zones where quick decisions are made Slow Trip Progression Map End The transverse aisle is used as an expressway to checkout which creates an opportunity to remind shoppers to purchase Start Source: 2005 Supercenter PathTracker Study
Shoppers treat the supercenter very much like two distinct stores In the Supercenter Studied, Only 1 in 5 Shoppers Shopped in both Grocery and GM sides of store SUPERCENTERSTUDY Implication: Displays in the general merchandise section and the grocery side will have very little duplication (Right Side) Traditional Grocery Offering/Entertainment Dept. (dairy included on right side) (Left Side) Non-food/Large Ticket Items/Pharmacy ONLY 22% Percent Shopped Both Sides (Compared to 43% for an average Supercenter)* 45% shopped the left side 77% shopped the right side Average Buy Time: Among all shopping occasions (~30,000), ABT is the average time spent per shopper where a purchase incidence was measured Source: 2005 Supercenter PathTracker Study *Retail Forward
Flow of Supercenter Grocery Shoppers is Similar to Supermarkets – But General Merchandise is Different SUPERCENTER STUDY Implication: Adapting to the varying traffic flow paths should provide guidance on where to locate in-store displays and messaging Shoppers shop counterclockwise in the grocery side of the store Shoppers shop clockwise in the general merchandise side Arrows indicate the dominant flow in each area of the store. Beverage location map included in Appendix Source: 2005 Supercenter PathTracker Study
Supercenter Shopper DensityDifferences Among Quick, Medium and Longer Shoppers SUPERCENTER STUDY High Density • Quick Trip Shoppers ( 0 – 3 minutes) • 0%visit more than 1/4 of the store; • Front end, bakery/deli and customer service are focus Low Density High Density • Medium Trip Shoppers (3 – 10 min.) • 0%visit more than 1/4 of the store; • Front end, bakery/deli, CSDs and snacks show most activity Low Density High Density • Longer Trip Shoppers (20+ min.) • 50%visit more than 1/4 of the store; • Rear grocery aisles, bakery/deli, meat, produce, beverage & snack aisles most active Low Density To reach shoppers on shorter trips, the front end is key Source: 2005 Supercenter PathTracker Study
Secondary Beverage Displays are Critical for Reaching Supercenter Shoppers SUPERCENTERSTUDY % of Shoppers that Visited Category* * % of shoppers that came within approximately 6 feet of product availability Source: 2005 Supercenter RFID Study
Aisles with the Highest Visit/Dwell Times were Similar to Those in the Supermarket Sample SUPERCENTER STUDY Source: 2005 Supercenter RFID Study
Bisected Aisles May Enhance Shopability The % of longer trip shoppers visiting key aisles were higher for the supercenter sample, while dwell times were markedly lower Source: 2005 Supercenter and Supermarket RFID Studies
Shoppers on Longer Trips Have Longer Buy Times for CSDs, Water & NCBs SUPERCENTER STUDY • For CSDs, Bottled Water, and Non-Carbonated Beverages, buy times are proportional to the length of the shopper’s trip • The longer the shopper spends in the store, the longer they tend to spend making beverage purchase decisions • Some of this may actually be due to an increase in unplanned purchases – in general, as a shopper’s basket size increases, so does the proportion of unplanned purchases in the basket2 1Source: 2005 Supercenter PathTracker Study 2Source: "A Model of In-Store Consumer Decision-Making.“ Inman, Ferraro & Winer (April 2004)
Self-Checkout Use is Less Common in Supercenters than Supermarkets Supercenter shoppers were less than half as likely to use self-checkout than supermarket shoppers Trip length and self-checkout use may have a strong inverse relationship, but other factors could also be at play Sources: 2005 Supercenter and Supermarket PathTracker Studies
Outline • Trends & Pressures Affecting Consumers & Shoppers • Shopper Behavior: 2005 RFID Study Highlights • Turning Insights into Action • Turning In-Store Shopping Behavior into Shopper Marketing Opportunities • Front-Page Ads: Connecting with Shoppers Before the Trip
A Shopper’s In-Store Decision-Making Tends to Follow a Sequential Set of Steps Pre-Trip Post-Trip In-Store Influencing the shopper at each step is critical Source: Adapted from model created by Saatchi & Saatchi X
What Companies Say to Shoppers, and How they Say it, is a Critical Driver of Sales Lift Effectiveness of creative elements in generating incremental sales lift when added to displays (Respondents: CPG companies / Channels: Mass + Supermarkets ) Across all categories in Supers & Mass, imagery and messaging are key drivers of incremental sales Less effective More effective Source: In-Store Marketing Institute/P-O-P Times; All Categories
Discovery of Three In-Store Shopping Zones has Implications for Marketing to Shoppers During the Trip Zone 3 Total Store Shoppers Shoppers that shop throughout the store; much more likely to be longer trip shoppers Zone 3 Zone 1 Zone 2 • Zone 2 • Quicker Decision Shoppers • Focused shoppers that spend 10 minutes or less to shop for a few items • Shoppers that are at the end of their trip and approaching the checkstands Zone 1 Early Progression Shoppers Shoppers that are beginning their trip; these shoppers may be quicker or longer trip shoppers The role of each point of messaging and availability can be more closely aligned with observed shopper behavior High Density Low Density Source: 2005 Supermarket RFID Study * Map is a combination of traffic and time spent
Taking an Integrated, Total Store View At each point of availability, our in-store marketing efforts should be aligned with the shopper’s behavior and motivations Total Store Shoppers Early Progression Shoppers Quicker Decision Shoppers How might we begin to think about the store differently?
Targeting Early Progression ShoppersApplying Insights to Early Displays Zone 1: Early Progression Shoppers • Characteristics of location: • Shopper Traffic: Very High • Decision-Making Time: None-Fast • Shopper Trip Types: Quick-Long • Stage in Trip Progression: Very Early • Illustrative Opportunities: • Generate excitement & awareness • Key promotions • “New news” • Engage the shopper early *Example only; further research and analysis in 2006 will further define opportunities for this area.
Targeting Early Progression ShoppersApplying Insights to Secondary Locations Permanent/Semi-Permanent Merchandising Zone 1: Early Progression Shoppers • Illustrative Opportunities: • Message to the shopper’s needs • Cross-promote with center store or higher margin perimeter categories • Showcase new products and variety (brand & pkg.) • Communicate information (e.g. product benefits or details) • Characteristics of location: • Shopper Traffic: High • Decision-Making Time: Slow • Shopper Trip Types: Medium & Long • Stage in Trip Progression: Early *Example only; further research and analysis in 2006 will further define opportunities for this area.
Connecting with Total Store ShoppersApplying Insights to Rear Endcaps Zone 3: Total Store Shoppers Endcap • Illustrative Opportunities: • Cross-promote (e.g. tie-in center store categories) • Drive new product awareness • Showcase variety (brand & pkg.) • Message to the shopper’s needs • Characteristics of location: • Shopper Traffic: High - Medium • Decision-Making Time: Med. Slow • Shopper Trip Types: Medium - Long • Stage in Trip Progression: Early - Late Middle *Example only; further research and analysis in 2006 will further define opportunities for this area.
Connecting with Total Store ShoppersApplying Insights to the Center Store Aisle Merchandising Iconography (Navigation) Segmentation (Information) Imagery (Inspiration) Zone 3: Total Store Shoppers • Characteristics of location: • Shopper Traffic: Low-Medium • Decision-Making Time: Med. Slow-Medium • Shopper Trip Types: Medium-Long • Stage in Trip Progression: Middle • Illustrative Opportunities: • Improve shopper navigation • Provide product information • Inspire the shopper to purchase (HCM-relevant imagery) *Source: Retail Marketing Services, UK (2002)
Connecting with Total Store ShoppersApplying Insights to Rear Endcaps Endcap Zone 3: Total Store Shoppers IC3 Messaging • Illustrative Opportunities: • Message to the shopper’s needs • Showcase variety (brand & pkg.) • Drive new product awareness • Connect the shopper with front-end categories (e.g. IC beverages) • Characteristics of location: • Shopper Traffic: Medium • Decision-Making Time: Med. Slow – Med. Fast • Shopper Trip Types: Medium - Long • Stage in Trip Progression: Early - Late Middle *Example only; further research and analysis in 2006 will further define opportunities for this area.