Download
1 / 13
130 likes | 288 Views
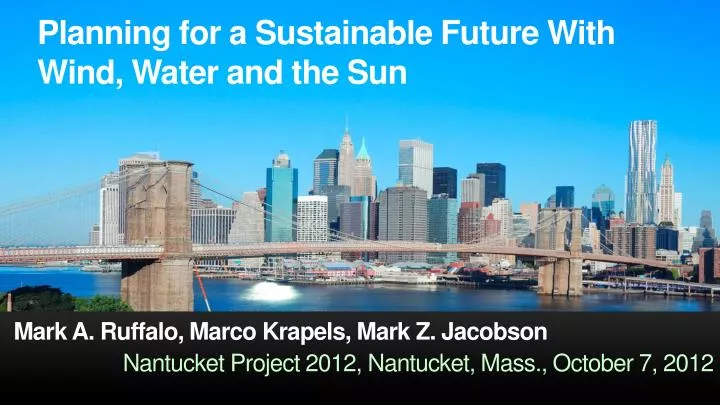
Planning for a Sustainable Future With Wind, Water and the Sun. Mark A. Ruffalo , Marco Krapels , Mark Z. Jacobson. Nantucket Project 2012, Nantucket, Mass., October 7, 2012. What’s the Problem? Why act Quickly?. Air pollution kills 2.5-3 million people worldwide each year.

E N D
Planning for a Sustainable Future With Wind, Water and the Sun Mark A. Ruffalo, Marco Krapels, Mark Z. Jacobson Nantucket Project 2012, Nantucket, Mass., October 7, 2012
What’s the Problem? Why act Quickly? Air pollution kills 2.5-3 million people worldwide each year. Arctic sea ice may disappear in 10-20 years. Global temperatures are rising at a faster rate than any time in history. Increasing population is increasing pollution, global warming, and energy prices. Higher energy prices lead to economic, social, political instability Drastic problems require immediate and definite solutions
Cleanest Solutions to Global Warming, Air Pollution, Energy Security ELECTRIC POWER VEHICLES Recommended – Wind, Water, Sun (WWS) 1. Wind 2. CSP WWS-Battery-Electric 3. Geothermal 4. Tidal WWS-Hydrogen Fuel Cell 5. PV 6. Wave 7. Hydroelectricity Not Recommended Nuclear Corn, cellulosic, sugarcane ethanol Coal-CCS Soy, algae biodiesel Natural gas, biomass Compressed natural gas Energy & Env. Sci, 2, 148 (2009)
End Use Power Demand For All Purposes WORLDU.S. NYS 2010 (TW)12.5 2.50 0.094 2030 with current fuels 16.9 2.83 0.096 2030 converting all energy To wind-water-sun (WWS) and electricty/H2 11.5 1.78 0.060 2030 reduction (%) due toWWS32 37 37
Number of Plants or Devices to Power NYS TECHNOLOGY PCT SUPPLY 2030NUMBER 5-MW onshore wind turbines10% 4020 5-MW offshore wind turbines 40 12,700 5-kW Res. roof PV systems 6 5 million 100-kW com/gov roof PV systems 12 500,000 50-MW Solar PV plants 10 828 100-MW CSP plants 10 387 100-MW geothermal plants 5 36 1300-MW hydro plants 5.5 6.6 (89% in place) 1-MW tidal turbines 1 2600 0.75-MW wave devices 0.5 1910 100%
Area to power 100% of NYS for allpurposeswith WWS Onshorewind: footprint=0.05 km2 spacing=1.46% of NYS (blue is open space) Geothermal 0.01% of NYS Offshore wind: spacing= 4.62% of NYS (blue is open space) Solar PV+CSP power plants 0.85% of NYS All rooftop PV (0.45% of NYS)
New York StateWind Resources Dvorak et al., 2011
Matching Power Demand With Solar, Wind, Geothermal, Hydro California electricity was found to be obtainable from WWS for 99.8% of all hours in 2005, 2006 without over-sizing WWS capacity, using demand-response, or using much CSP storage. Hart and Jacobson (2011); www.stanford.edu/~ehart/
Costs of Energy, Including Transmission (¢/kWh) ENERGY TECHNOLOGY 2008-2010 2020-2030 Wind onshore 4-7 ≤4 Wind offshore 10-17 8-13 Wave >>11 4-11 Geothermal 4-7 4-7 Hydroelectric 4 4 CSP 10-15 7-8 Solar PV 9-13 5-7 Tidal >>11 5-7 Conventional (+Externalities) 7 (+5.3)=12.3 8-9.6(+5.7)=13.7-15.3 Jacobson & Delucchi (2011)
Costs Increase of Residential Electric Power 2003-11 • Five states with highest percent of electric power from wind +2 ¢/kWh • Remaining 45 states +3.6 ¢/kWh • States with greatest increases in percent of electricity from wind experienced lowest electric power price increases. http://www.eia.gov/electricity/sales_revenue_price/)
Health Cost Savings due to WWS in NYS Air pollution kills 4000/year in NYS, costing $33 billion/year, or 3% of NYS GDP NYS needs ~270 GW ($570 billion) of installed power to convert to WWS for all purposes. Health cost savings alone would pay for WWS in ~17 y July 15, 2012 by DS Jacobson
New Jobs and Price Stability From WWS in NYS WWS will generate 71,000 permanent jobs/year for energy facilities alone. Since >98% WWS will be in NYS but most fossils are from out of state, conversion to WWS increases NYS jobs. Since WWS fuels are free, their prices do not fluctuate. Info.ussolarinstitute.com
Summary of Plan to Power NYS with WWS • Converting to WWS and electricity/H2 will reduce NYS power demand ~37% • Eliminate ~4000 air pollution deaths/yr in NYS • Reduce air pollution cost to NYS by $33 billion/yr (3% of GDP) • Reduce global warming cost to NYS by $3.2 billion/yr by 2050 • Generate 71,000 permanent jobs/yr for energy facilities alone. • Economic electricity costs of WWS are now lower than those of fossil fuels • Requires only 0.96% more NYS land for footprint; 1.46% for spacing • Multiple methods of addressing WWS variability. • www.stanford.edu/group/efmh/jacobson/Articles/I/susenergy2030.html