Download
1 / 33
330 likes | 398 Views
MAIX STAT EXAM 2010. Q3: An experiment is a study design that allows us to prove a cause-and-effect relationship. A (comparative) experiment : Manipulates factor levels to create treatments. Randomly assigns subjects to these treatment levels.

E N D
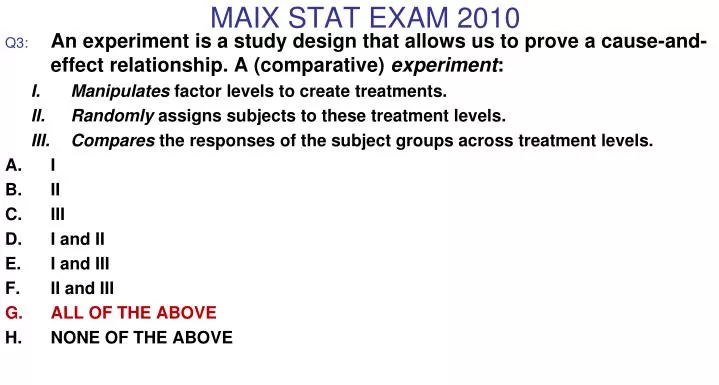
MAIX STAT EXAM 2010 Q3:An experiment is a study design that allows us to prove a cause-and-effect relationship. A (comparative) experiment: Manipulates factor levels to create treatments. Randomly assigns subjects to these treatment levels. Compares the responses of the subject groups across treatment levels. I II III I and II I and III II and III ALL OF THE ABOVE NONE OF THE ABOVE
MAIX STAT EXAM 2010 Data in JMP is (are) organized numbers and or characters with a context where the rows refer to the “WHAT” and the columns to the “WHO” of the study data AGREE DISSAGREE
MAIX STAT EXAM 2010 In the following table of car data. Level Count American 212 Asian 102 European 45 TOTAL 359 What is the FREQ and REL FREQ of “Europen CARS”? 212 and 0.591= (212/359) 102 and 0.284=(102/359) 45 and 0.125=( 45/359) ALL of the ABOVE
MAIX STAT EXAM 2010 Wish of the following statements about the Standard Normal Density (z tables) is NOT TRUE a) It ALWAYS has mean 0 and variance 1 b) It is derived from ANY Normal Density if we “standardize” it by subtracting its mean and dividing by its standard deviation c) Tables of it can be found in any STAT book and it could be used to answer ALL questions concerning ANY NORMAL distributions d) ALL of the above e) NONE of the above
MAIX STAT EXAM 2010 What is the correct answer for the std dev of the following set: 22,23,24,25,26. zero 1 2.49 2.5 SQRT(2.5) None
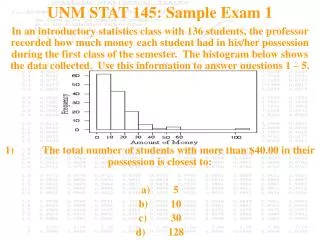
MAIX STAT EXAM 2010 The picture supplied represents the age distributions (for those 33 that submitted their personal info). Q) a)Is the mean larger than the median for age (years) and b) is the distribution positively skewed AGREE (YES & YES) DISSAGREE (YES, NO) DISSAGREE (NO, YES) DISSAGREE (NO, NO)
MAIX STAT EXAM 2010 The picture supplied represents the age distribution (for those 33 that submitted their personal info). Q) a)The IQR is 3 years and b) because of that only students younger than 19.5 and older than 28 should be marked as outliers. AGREE (YES & YES) DISSAGREE (YES, NO) DISSAGREE (NO, YES) DISSAGREE (NO, NO)
MAIX STAT EXAM 2010 The picture supplied represents the age and sex distributions (for those 33 that submitted their personal info). Q) a)The standard Err Mean is calculated Std Dev / 32 Std Dev / 33 Std Dev / SQRT(32) Std Dev / SQRT(33)
MAIX STAT EXAM 2010 The picture supplied represents the age and sex distributions (for those 33 that submitted their personal info). Q) Is the mean age significantly different than 24 (years) based on the 95% CI provided AGREE DISSAGREE
MAIX STAT EXAM 2010 The picture supplied represents the age and sex distributions (for those 33 that submitted their personal info). Q) To test the one-tail alternative that the mean age is Higher (>24) then we should reject the null AGREE (reject Ho) DISSAGREE (fail to reject Ho)
MAIX STAT EXAM 2010 Q1:If weight was measured in kilograms (kg) and height was measured in centimeters (cm) then if their correlation was .72 then it’s units are in ___. kg*cm kg/cm cm/kg NONE of the above (it does not have units)
MAIX STAT EXAM 2010 Q1:If weight was measured in kilograms (kg) and height was measured in centimeters (cm) then if their correlation was .72 then we can conclude RSquare=(.72)2 > .5 which implies that both a little over 50% of the variations in weight can be explained by height and vise versa. AGREE DISSAGREE
MAIX STAT EXAM 2010 The picture supplied represents the Weight (kg) to Height (cm) (for those 33 that submitted their personal info). Q) a) Is the a significant negative linear relationship b) The RSquare is >50% AGREE (YES & YES) DISSAGREE (YES, NO) DISSAGREE (NO, YES) DISSAGREE (NO, NO)
MAIX STAT EXAM 2010 The picture supplied represents the Weight (kilos) to Height (cm) (for those 33 that submitted their personal info). a) Did you agree from the least squares line that for every one cm that “you grow”(height) we should expect on average that your weight will increase by less than one Kilo AGREE DISSAGREE
MAIX STAT EXAM 2010 The analysis of AGE by SEX for those 33… a) Did you agree something MUST BE WRONG since it appears that a 34 year old M is is not an outlier when both 33 and 34 year old females are “appearing too old” since they are marked as outliers. AGREE DISSAGREE
MAIX STAT EXAM 2010 The analysis of AGE by SEX for those 33… The two tail test for testing the null hypothesis of no difference in the average age of males and females (STAT MAIX students) against the two tail alternative leads us to reject the null AGREE DISSAGREE
Q2) Under the null hypothesis of (independence) the expected(E) number of low birth weight babies born to smoking mothers is • 189* (74/189)*(59/189) • =23.1 • TRUE • FALSE MAIX STAT EXAM 2010
MAIX STAT EXAM 2010 • Q3) The (2,2) cell Chi Square contribution is calculated by using the observed (O=30) and expected (E=23.1) by the following formula • (E-O)2 / O • (E-O) / E • (O-E)2 / E • (O-E) / E • NONE OF THE ABOVE
MAIX STAT EXAM 2010 Q4) The Pearson overall Chi Square statistic for testing the Ho null hypothesis of independence is calculated by summing the cell Chi squares contributions with (2-1)*(3-1)=2 degrees of freedom (d.f.) for each cell and the conclusion is TRUE and NOT reject Ho FALSE and reject Ho TRUE and reject Ho. FALSE and reject Ho NONE OF THE ABOVE
MAIX STAT EXAM 2010 The objectives of simple linear regression are: To compare the values of the response variable given the identification level of a nominal predictor variable. To assess the significance of the predictor variable in explaining the variability or behavior of the response variable To predict the values of the response variable given the values of the predictor variable. ALL OF THE ABOVE B and C only
MAIX STAT EXAM 2010 A pharmaceutical manufacturer would like to be able to claim that its new headache relief medication is better than those of rivals. Also it has two methods fro formulating its product, and it would like to compare these as well. From a small experiment use the data HEADACHE.JMP In the data set from this small experiment the categories in the column Drug are: (1) active component #1, (2) active compound #2, (3) rival product and (4) control group (aspirin). Q) Is the test that we use to compare the four drugs here an extension of Two-Group t test other ways called one-way Anova test • AGREE • DISSAGREE
MAIX STAT EXAM 2010 What decision can be reached from these data without changes: • Reject the null • Fail to reject the null at the 5% alpha level. • Cannot tell
MAIX STAT EXAM 2010 Failing to reject a FALSE null hypothesis “translates to letting a criminal go free” which is usually refer to as Type II Error AGREE Dissagree
MAIX STAT EXAM 2010 We always reject the null hypothesis if the P value is SMALLER than the alpha level of significance (usually 5% that we usually refer to as Type I Error). AGREE DISSAGREE
MAIX STAT EXAM 2010 The Central Limit Theorem (CLT) states that ________ , the sampling distribution of the sample mean of samples of size n drawn from the same population will approach a ____ distribution, In addition we know that this distribution will have a mean equal to the population mean and a std deviation equal to ______________. 1 n increases, 2 population std. deviation , 3 population mean 4 / n , 5 Normal , 6 Uniform, 7 population median, 8 IQR/n 1, 5, 8, 1, 5, 2, 6, 2, 7, 6, 2, 8, NONE OF THE ABOVE
MAIX STAT EXAM 2010 A level C confidence interval for a ________ has two parts. An interval of the form ______ __________ A ______ C, which gives the ______________ that __________________. 1) zero , 2) two sigma, 3) confidence level, 4) interval found this way catch the parameter value, 5) margin of error 6)population parameter, 7) probability 8) sample 9) sampling distribution 10) statistic 11) the parameter equals the statistic 6, 10, 5, 3, 7, 4 10, 6, 5, 3, 7, 11 6, 10, 5, 3, 7, 11 10, 6, 5, 3, 7, 4 NONE OF THE ABOVE
MAIX STAT EXAM 2010 General Addition Rule: For any two events A and B, P(A or B) = P(A) + P(B) + P(A and B) If the events are mutually disjoint then the above formula becomes P(A or B) = P(A) + P(B) since P(A and B) =0 TRUE FALSE
MAIX STAT EXAM 2010 The general multiplication rule states that The P(A and B)= P(A) + P(B|A) The P(A and B)= P(B) + P(A|B) Reduces to the multiplication rule if A and B are independent that is P(A and B) = P(A)*P(B) ALL OF THE ABOVE NONE OF THE ABOVE
MAIX STAT EXAM 2010 The graph display to help us investigate how RAIN relates to ALTITUDE, LATITUDE AND COASTDIST is called: Segmented bar chart Histogram Stem and leaf plot Scatterplot(s) NONE of the above
MAIX STAT EXAM 2010 (A) AGREE, (B) DISSAGREE The graph display below to investigate how RAIN relates to ALTITUDE, LATITUDE AND COASTDIST suggests the following conclusions about the correlations: WEAK +, MODERATE + , WEAK -
MAIX STAT EXAM 2010 A manufacturer claims that lifespan for their copy machines (in months) can be described by a Normal model N (=42,=7). What percent we expect to still work beyond the first 35 months 25% .50 75% .95 NONE OF THE ABOVE
MAIX STAT EXAM 2010 The best defense against bias is randomization in which each individual is given a fair random choice of selection. Nevertheless most Sample Surveys suffer (things that might go bad that will usually result) with some form of bias such as: I) Undercoverage II) Nonresponse bias III) Voluntary response bias IV) Response bias I II III IV NONE OF THE ABOVE USUALLY MORE THAN ONE OF THE ABOVE
MAIX STAT EXAM 2010 Q3:An experiment is a study design that allows us to prove a cause-and-effect relationship. A (comparative) experiment: Manipulates factor levels to create treatments. Randomly assigns subjects to these treatment levels. Compares the responses of the subject groups across treatment levels. I II III I and II I and III II and III ALL OF THE ABOVE NONE OF THE ABOVE