Download
1 / 1
10 likes | 149 Views
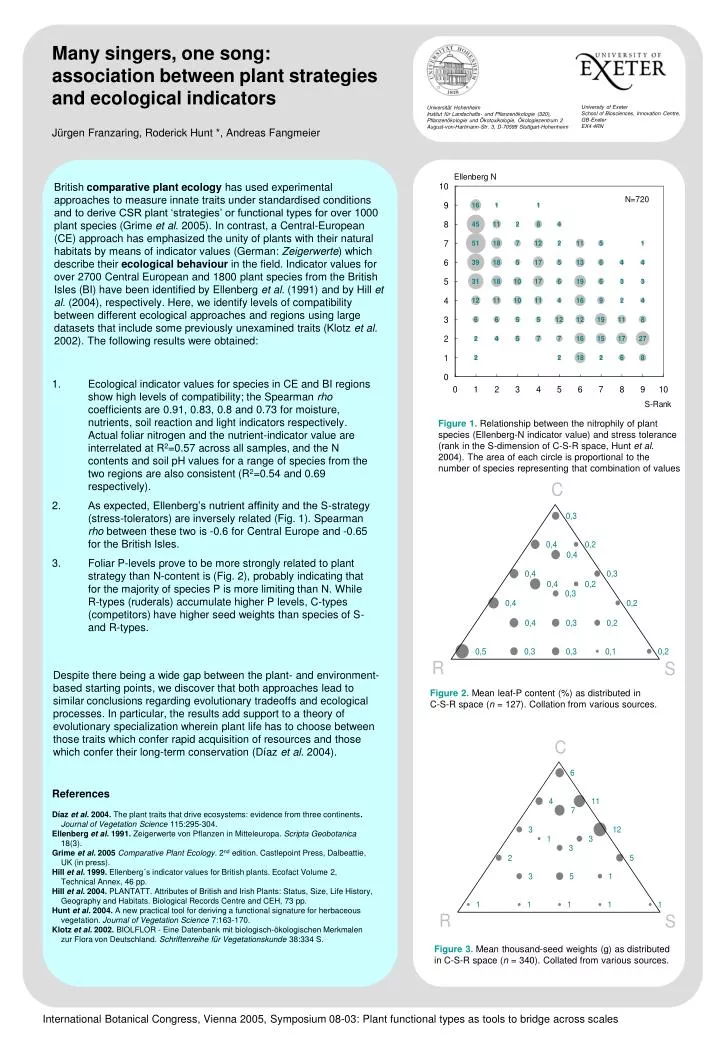
Figure 1. Relationship between the nitrophily of plant species (Ellenberg-N indicator value) and stress tolerance (rank in the S-dimension of C-S-R space, Hunt et al. 2004). The area of each circle is proportional to the number of species representing that combination of values.

E N D
Figure 1.Relationship between the nitrophily of plant species (Ellenberg-N indicator value) and stress tolerance (rank in the S-dimension of C-S-R space, Hunt et al. 2004). The area of each circle is proportional to the number of species representing that combination of values Figure 2.Mean leaf-P content (%) as distributed in C-S-R space (n = 127). Collation from various sources. Figure 3.Mean thousand-seed weights (g) as distributed in C-S-R space (n = 340). Collated from various sources. Many singers, one song: association between plant strategies and ecological indicators University of Exeter School of Biosciences, Innovation Centre, GB-Exeter EX4 4RN Universität Hohenheim Institut für Landschafts- und Pflanzenökologie (320), Pflanzenökologie und Ökotoxikologie, Ökologiezentrum 2 August-von-Hartmann-Str. 3, D-70599 Stuttgart-Hohenheim Jürgen Franzaring, Roderick Hunt *, Andreas Fangmeier British comparative plant ecology has used experimental approaches to measure innate traits under standardised conditions and to derive CSR plant ‘strategies’ or functional types for over 1000 plant species (Grime et al. 2005). In contrast, a Central-European (CE) approach has emphasized the unity of plants with their natural habitats by means of indicator values (German: Zeigerwerte) which describe their ecological behaviour in the field. Indicator values for over 2700 Central European and 1800 plant species from the British Isles (BI) have been identified by Ellenberg et al. (1991) and by Hill et al. (2004), respectively. Here, we identify levels of compatibility between different ecological approaches and regions using large datasets that include some previously unexamined traits (Klotz et al. 2002). The following results were obtained: • Ecological indicator values for species in CE and BI regions show high levels of compatibility; the Spearman rho coefficients are 0.91, 0.83, 0.8 and 0.73 for moisture, nutrients, soil reaction and light indicators respectively. Actual foliar nitrogen and the nutrient-indicator value are interrelated at R2=0.57 across all samples, and the N contents and soil pH values for a range of species from the two regions are also consistent (R2=0.54 and 0.69 respectively). • As expected, Ellenberg’s nutrient affinity and the S-strategy (stress-tolerators) are inversely related (Fig. 1). Spearman rhobetween these two is -0.6 for Central Europe and -0.65 for the British Isles. • Foliar P-levels prove to be more strongly related to plant strategy than N-content is (Fig. 2), probably indicating that for the majority of species P is more limiting than N. While R-types (ruderals) accumulate higher P levels, C-types (competitors) have higher seed weights than species of S- and R-types. Despite there being a wide gap between the plant- and environment-based starting points, we discover that both approaches lead to similar conclusions regarding evolutionary tradeoffs and ecological processes. In particular, the results add support to a theory of evolutionary specialization wherein plant life has to choose between those traits which confer rapid acquisition of resources and those which confer their long-term conservation (Díaz et al. 2004). References Díaz et al. 2004. The plant traits that drive ecosystems: evidence from three continents. Journal of Vegetation Science 115:295-304. Ellenberg et al. 1991. Zeigerwerte von Pflanzen in Mitteleuropa. Scripta Geobotanica 18(3). Grime et al. 2005Comparative Plant Ecology. 2nd edition. Castlepoint Press, Dalbeattie, UK (in press). Hill et al. 1999. Ellenberg´s indicator values for British plants. Ecofact Volume 2, Technical Annex, 46 pp. Hill et al. 2004. PLANTATT. Attributes of British and Irish Plants: Status, Size, Life History, Geography and Habitats. Biological Records Centre and CEH, 73 pp. Hunt et al. 2004. A new practical tool for deriving a functional signature for herbaceous vegetation. Journal of Vegetation Science 7:163-170. Klotz et al. 2002. BIOLFLOR - Eine Datenbank mit biologisch-ökologischen Merkmalen zur Flora von Deutschland. Schriftenreihe für Vegetationskunde 38:334 S. International Botanical Congress, Vienna 2005, Symposium 08-03: Plant functional types as tools to bridge across scales