Download
1 / 31
310 likes | 431 Views
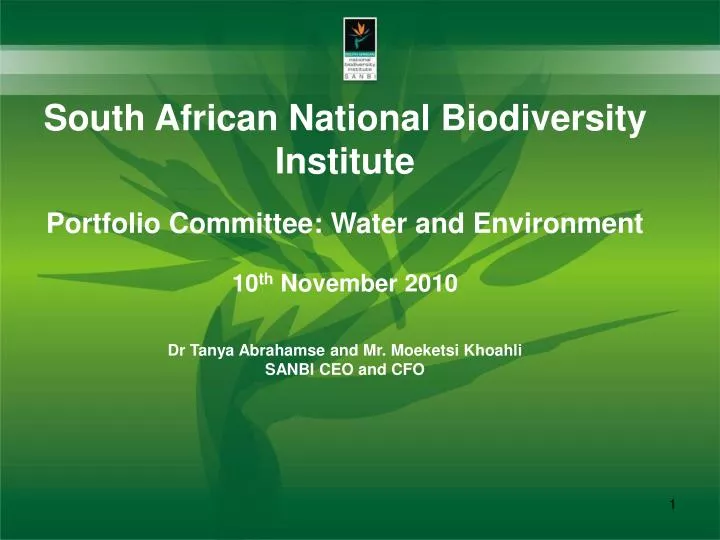
South African National Biodiversity Institute Portfolio Committee: Water and Environment 10 th November 2010 Dr Tanya Abrahamse and Mr. Moeketsi Khoahli SANBI CEO and CFO. SANBI presentation. South African National Biodiversity Institute.

E N D
South African National Biodiversity Institute Portfolio Committee: Water and Environment 10th November 2010 Dr Tanya Abrahamse and Mr. Moeketsi Khoahli SANBI CEO and CFO
South African National Biodiversity Institute • Vision: Biodiversity richness for all South Africans • Mission : • To champion the exploration, conservation, use, appreciation and enjoyment of South Africa’s exceptionally rich biodiversity for all people
Some information about SANBI • Created in 2004 by the NEMBA • Built on the foundation of NBI (Botanical Conservation research, Herbaria & Gardens) with over a 100 years history of botanical exploration and science • Located in 9 National Botanical Gardens (NBG) HO in Pretoria • Total 719 Staff members of which half are Garden Management • Annual Income - approx R331.4m • Total annual operations expenditure approx R343.2m and so approx deficit of R11.8m • Split between MTEF (approx R150.8), own income (approx R44.0m) and donor funds and other grants (approx R137.0m) • Unique Biodiversity institution globally – an arrangement considered to be worlds best practice
SANBI’s GOAL towards the Vision SANBI is strategically positioned to harness South Africa’s biodiversity capacity and is recognised as the first port of call for knowledge, information and policy advice on biodiversity in South Africa and the region.
6 KEY RESULT AREAS • KRA 1: Understanding biodiversity and understanding bio-adaptation to climate change • KRA 2: Models for integrated biodiversity management • KRA 3: Conservation Gardens • KRA 4: Policy advice • KRA 5: Managed network and human capital development • KRA 6: Effective systems and processes • New KRA 7 in 2010-11
KRA1: Understanding biodiversity and bio-adaptation to climate change SANBI will put in place structures, networks, and leadership for scientific enquiry and for generating biodiversity knowledge in key policy-relevant areas 1.1. A national biodiversity research strategy & framework for SA is developed and implemented and reviewed whenappropriate. 1.2. A research agenda relating to climate change &bio-adaptation is developed & implemented, and knowledgebeneficiated & documented. 1.3 Research in key policy-relevant areas is undertaken, guided by the priorities in the National Biodiversity Strategy & Action Plan (NBSAP) and the National Biodiversity Framework (NBF). 1.4. A Comprehensive Biodiversity Monitoring Framework is developed, approved and implemented. 1.5. Priority threatened species and ecosystems for SA areidentified (both spatially and thematically).
KRA 2: Models for integrated biodiversity management SANBI will co-ordinate and facilitate collaborative biodiversity programmes which innovate, pilot and mainstream new models for biodiversity management • 2.1. Collaborative cross - sectoral biodiversity programmes • dealing with threatened biomes and ecosystems are • hosted by SANBI and operating effectively. • 2.2. Best practice models for biodiversity management are • developed and piloted. • 2.3. Lessons from biodiversity mainstreaming pilots are • synthesised and shared.
KRA 3: Conservation Gardens • SANBI will expand and strengthen the role of national botanical gardens to provide a national footprint in nature-based tourism, conservation gardens, and showcasing SANBI and biodiversity. • 3.1. Gardens expansion strategy is developed and implemented. • 3.2. One additional garden in an under represented biome/province is established. • 3.3. Profiling of biodiversity issues and SANBI programmes is effected through garden programmes. • 3.4. Revenue generating activities in gardens are strengthened.
KRA 4: Policy advice SANBI will provide science-based policy advice in support of sustainable development 4.1. Biodiversity policy support for DEA is provided. 4.2. Policy development & decision-making relating to climate changeis enhanced by increasing access to appropriate scientific knowledge. 4.3. Biodiversity concerns are mainstreamed in the policies of key sectors. 4.4. Clear policy messages emerge from SANBI’s work and are appropriately packaged for targeted audiences. 4.5. Lessons learned from science into policy arecaptured and shared.
KRA 5: Managed network and human capital development SANBI will build partnerships through its managed network to strengthen and co-ordinate the biodiversity sector, and will be the recognised strategic partner in human capital development for the sector 5.1. Structures & processes in place to enable &support managed network partnerships that contribute to implementation of SANBI’s Strategy 5.2. SANBI’s capacity to mobilise, synergise and catalyse the biodiversity sector is recognised by funders. 5.3 The contribution of the managed network to human capital development and transformation is strengthened. 5.4. Young South African biodiversity professionals receive training & mentoring. 5.5. SANBI is the recognized one-stop-shop for accessing biodiversity info. 5.6. Standards, structures, and direction for biodiversity collections, surveys, maps, inventories, and catalogues are provided.
KRA 6: Effective systems and processes SANBI will put in place the effective operational, financial, and governance systems to support effective implementation of its mandate. 6.1 An enabling environment that attracts & retains bio professionals is created. 6.2 An effective strategy for transformation is implemented. 6.3 A financial strategy that provides a sustainable funding base for SANBI’s existing and expanding activities is effectively implemented. 6.4 Financial systems/ policies that comply with Treasury guidelines and public sector governance requirements respectively are in place. 6.5 Effective monitoring & reporting info systems are in place to assist, monitor, report, assess & provide progress ensuring service delivery is improved. 6.6 An effective brand development plan that incorporates a marketing and communications strategy & corporate identity is developed & implemented 6.7 An effective corporate communication strategy is implemented. 6.8 SANBI’s mandated activities are effectively marketed.
Challenges • Lack of funds to fulfil mandate and expectations as set out in SANBI CSP 2010 and Annual Business Plan – have submitted a revised BP 2010 to DEA • Budget Deficit Management and generating income from assets given that SANBI is for the public good • Making the economic, social & development ‘value’ case for biodiversity – including ecosystem services and green jobs. • Delivering our Biosystematics and Collections mandate • To excite the majority of population about the value and pleasure of biodiversity.
Budget Deficit Managementin summary • Focus • reducing personnel costs • Increasing own income • ring-fencing projects • Actions to date • Reduced top structure – new slimmed-down organogram • Removed non-critical vacant MTEF funded posts • Removed Urban Conservation, incorporated into Municipal program • Reviewed Education to achieve objectives with less budget • Redeployed /transfer of Education and Urban Conservation personnel to critical MTEF funded posts and project funded posts • No retrenchments or redundancies • Some change to our Business Plan
SANBI’s BUDGET PRIORITIES • (over and above existing commitments) • 1. Gardens Expansion • -Eastern Cape site – feasibility done. • - Now at DEA to do legal steps • - Money for Capital but none for Ops • - In Minister’s delivery agreement under Outcome 10 • 2. Biodiversity Monitoring • - Comprehensive framework being developed for both Plants and animals. • -Proposal for additional funding through MTEF process • - Mandate critical • 3. Green Economy • - In support of the Green Economy Strategy & Plan of Government • - Making the value case for Biodiversity • - Ecosystem services • - Job Creation and livelihoods • 4. Climate Change Bio-adaptation • - In support of DEA’s Adaptation Strategy for the Biodiversity sector • 5. Biosystematics and Collections • - Mandate critical • - After NRF’s national review and recommendations • - Proposal for additional money through MTEF process
REVENUE GENERATION PLAN • Own income R31,4m (+5%) • Balance Project Income • Interest Earned • Admissions Fees • Admin Fees from Projects • Rent received • Staff Accommodation Charges • Sponsorships, Donations & Other grants • Commission received • Discounts Earned • Professional services rendered • Public functions • Use of garden facilities • Film location fees • 2. SALES R2.0m
Income • Total income including the government grant decreased by -0.6% (R2.0 million) from R333.4 million (2009) to R331.4 million (2010). The Department of Environmental Affairs (DEA) increased its grant by 17.1% for the year under review. In terms of the 17.1%, only 6.6% relates to the MTEF base grant allocation and the difference is allocated to specific projects. • Other grants, sponsorships and donations decreased with R26.5 million. Except for the EPWP grant, the decrease can be attributed to the global economic recession. • Own Income • Income from rent received increased by R0.8 million or 10% (R8.2 million: 2010; R7.5 million: 2009) from the previous year. These facilities are outsourced and the rent is based on a percentage of turnover made by the operator. • Income on disposal of property, plant and equipment decreased from R0.5 million (2009) to R0.03 million (2010). The disposals income consists mainly of insurance pay-outs. • Other income • consisted of professional services rendered, guided tours conducted, commissions, and seminars and workshops hosted. Other income amounted to R2.5 million in 2009 and increased to R4.6 million in 2010. The increase of 81% (R2 million) is mainly attributable to higher fees generated in 2010 for professional services rendered.
The total expenses, increased by 2% (R6 million) from R337.2 million (2009) to R343.2 million (2010). • Non-current Assets • Non-current assets decreased by 4% (R8 million). The decrease was mainly due to the reduction in asset spending of R8.4 million. Land and buildings amounted to R4.4 million, equipment to R1.6 million, vehicles to R0.5 million and intangible assets to R0.6 million. Depreciation and amortisation amounted to R14.7 million. Defined Benefit Asset of R5.5 million (2010) and R5.0 million (2009) was recognised due to revised actuarial valuations. • Current Assets • Current assets increased by R20.1 million (45%), cash and cash equivalents increased by R20.9 million (50%). Consumables decreased by R0.5 million (82%) and Trade and other receivables decreased by R0.3 million (11%). • Non-current Liabilities • Non-current liabilities increased by R0.7 million (3%). The reason for the increase is as follows: • R0.7 million (3%) increase in post-retirement medical aid benefit. This is a direct result of the increase in medical aid benefit costs and SANBI’s employees with exceptionally long service history.
Current Liabilities • Current liabilities increased by R23.2 million (28%). The increase is due to the net effect of: • Unspent project funds to the amount of R62.4 million (+72%). Unspent project funds transferred amounted to R56.1 million for externally funded projects and R6.3 million for MTEF projects. The utilisation of project funding received in advance is continuing year-on-year. • Decrease in trade and other payables of R2.8 million (6%). • Cash flow statement • The deficit for the year is R11.8 million, and after adjusting for non-operating elements (Depreciation and amortisation of R14.7 million, Investment income R2.7 million, interest paid R0.002 million, and profit on disposal of assets R0.03 million), the resultant operating surplus before working capital changes is R0.7 million. • Auditor’s reports • The Auditor General considered the internal audit reports issued during the year and the audit findings. The AG issued an unqualified report after focusing primarily on SCM, Assets and Expenses.
Thank You • for your support