Download
1 / 62
620 likes | 627 Views
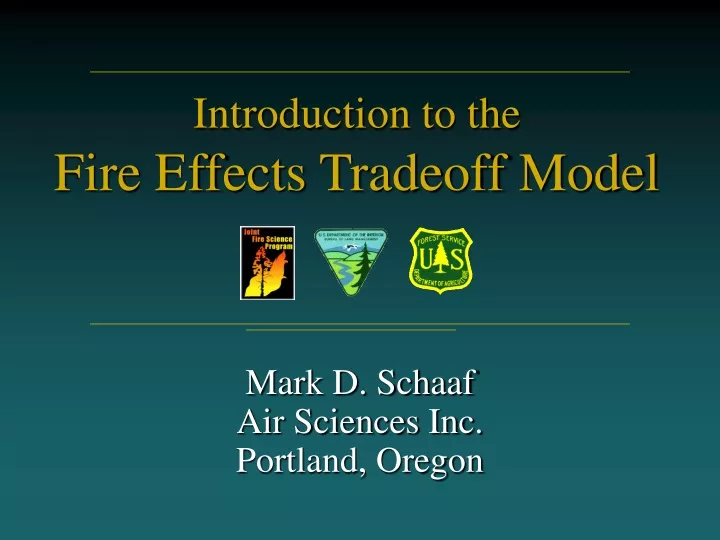
Introduction to the Fire Effects Tradeoff Model. Mark D. Schaaf Air Sciences Inc. Portland, Oregon. Outline. Overview of FETM Capabilities “Tree Diagram” Structure Example Outputs Concluding Remarks. Overview. Landscape-scale disturbance model

E N D
Introduction to theFire Effects Tradeoff Model Mark D. SchaafAir Sciences Inc.Portland, Oregon
Outline • Overview of FETM • Capabilities • “Tree Diagram” Structure • Example Outputs • Concluding Remarks
Overview • Landscape-scale disturbance model • Designed to simulate the long-term effects of management activities and natural disturbances on vegetation: • Vegetation composition • Wildland fire acres burned • Residue loading and consumption • Smoke production • Fire and fuel treatment costs
Overview • Also designed to demonstrate tradeoffs between different types of disturbances (for example, prescribed fire vs. wildfire acres and emissions) • Focus is on fire behavior and effects (by vegetation class, and for the entire landscape)
Overview • Stochastic—Number of fire starts per year treated as random variable • Dynamic—Deals with annual changes over any future time period, 1 to ~300 years • Non spatial—Results are tracked by vegetation class (FCC), without regard to location
Overview • Public domain software • Designed for use by any organization (federal, state, private)
Capabilities • Incorporates use of multi-layer fuel characteristic classes (FCC) to describe current/future vegetation • Single or multiple disturbances: • Management activities (e.g., thinning) • Insects & disease • Fire • Succession (absence of disturbance)
Capabilities • Comprehensive treatment of fire • Incorporates state-of-the-science models: • CONSUME • NFDRS Calculations • Fire type algorithm used in FARSITE • PC Historical Analysis (PCHA) model • Interagency Initial Attack Assessment (IIAA) model
Capabilities • Allows management activities to be scheduled year-by-year. • Links weather/surface loading/stand characteristics tofire behavior and number of wildfire acres • Allows user to look at single-sequence fire effects, and expected fire effects(average of multiple sequences)
Capabilities • Easy to use (with good team selection) • Fast run times • Produces multiple graphs and tables • Capability to “cut and paste” results into documents
Tree Diagram Structure • Windows-based • Expandable index tree format on left-hand side • Data input and output forms displayed on right-hand side
Methodology Current VegetationDescription Rx Fire Treatment Schedule Collect Data Parameterize FETM HistoricalFire Data Define Scenarios Historical Weather Run Model Report Results
Methodology Collect Data Define FCCs Populate Effects Matrices Parameterize FETM Map FCCs to Fire Behavior Models Calculate Crown Loading Define Scenarios Define Weather Classes Calculate Fire Typeby Weather Class Run Model Report Results
Methodology Collect Data Select Disturbances Select FCCs Parameterize FETM Select Simulation Period SelectPollutants Define Scenarios Select Economic Assumptions Run Model Select Number of Iterations Report Results
Methodology Collect Data Parameterize FETM Define Scenarios Run Model Report Results
Methodology Collect Data Parameterize FETM Define Scenarios Run Model Report Results
Density 1Density 2Density 3Density 4Density 5 Example Outputs Alternative 1: No Prescribed FireNorthern Mixed Chaparral
Density 1Density 2Density 3Density 4Density 5 Example Outputs Alternative 2: 7,500 Chaparral Acres Per YearNorthern Mixed Chaparral
Density 1Density 2Density 3Density 4Density 5 Example Outputs Alternative 3: 15,000 Chaparral Acres Per YearNorthern Mixed Chaparral
Density 1Density 2Density 3Density 4Density 5 Example Outputs Alternative 4: 30,000 Chaparral Acres Per YearNorthern Mixed Chaparral
Example Outputs Alternative 1: No Prescribed Fire
Example Outputs Alternative 2: 7,500 Chaparral Acres Per Year
Example Outputs Alternative 3: 15,000 Chaparral Acres Per Year
Example Outputs Alternative 4: 30,000 Chaparral Acres Per Year
Example Outputs Alternative 1: No Prescribed Fire Alternative 1: No Prescribed Fire
Example Outputs Alternative 2: 7,500 Chaparral Acres Per Year Alternative 1: No Prescribed Fire
Example Outputs Alternative 3: 15,000 Chaparral Acres Per Year Alternative 1: No Prescribed Fire
Example Outputs Alternative 4: 30,000 Chaparral Acres Per Year Alternative 1: No Prescribed Fire
Concluding Remarks • State-of-the-science model that can be used to predict future landscapes and effects under different management strategies and fire protection policies • Similar in capability to other landscape models (e.g., SIMPPLLE, VDDT), but addresses fire effects in a more comprehensive manner
Concluding Remarks • The model, users guide, and technical documentation are available from Jim Russell, Region 6 Air Program Manager (jrussell01@fs.fed.us). • By April, FETM will be available for download from a web page linked to the Region 6 Air Quality web site.
Introduction to the Smoke Impact Spreadsheet (SIS) Model Mark D. SchaafAir Sciences Inc.Portland, Oregon
Outline • Overview • Capabilities • Example Screen Shots • Concluding Remarks
Overview of SIS • Simple-to-use, screening level emissions and dispersion modeling system. • Development sponsored by USDA Forest Service Region 1 Air Quality Program (Ann Acheson, Bob Hammer)
Overview of SIS • Uses state-of-the-art modeling techniques (e.g., FOFEM5 emissions model, CALPUFF dispersion model). • Goal to minimize development costs by using existing tools rather than creating an entirely new application.
Overview of SIS • Microsoft Excel provides user interface • First Order Fire Effects Model (FOFEM5) provides front-end emissions calculator • CALPUFF performs plume rise and downwind dispersion calculations • CALPOST averages the CALPUFF outputs
Capabilities • Computes 24-hour average PM2.5 concentrations along line of downwind receptors • Up to 10 co-located burn units, each with different areas and ignition start times.
Capabilities • Flat or complex terrain (affects airflow and receptor locations) • Uses single set of meteorological conditions (wind speed, wind direction, ambient temperature, stability class, mixing height). • “Time and persistence” factor accounts for changing meteorological conditions over periods exceeding 8 hours.
Capabilities Co-Located Areas 3 Line of Receptors 2 1 • Burn units modeled as co-located buoyant, square, area sources. • Receptors placed at regular intervals (0.1 miles) downwind of, and centered on, the area sources.
Terrain profile point Receptor Capabilities • SIS interpolates receptor elevations from a user-input terrain profile. • SIS uses the CALPUFF “plume path coefficient treatment” option to adjust the plume height over complex terrain.