Download
1 / 10
100 likes | 237 Views
According to World Health Organization report for calendar year 2001. US Mortality, 2004. No. of deaths. % of all deaths. Rank. Cause of Death. 1. Heart Diseases 652,486 27.2 2. Cancer 553,888 23.1 3. Cerebrovascular diseases 150,074 6.3

E N D
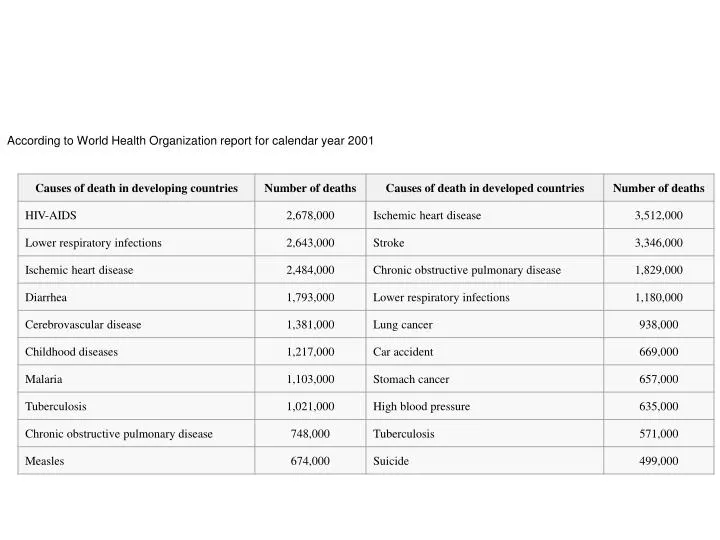
According to World Health Organization report for calendar year 2001
US Mortality, 2004 No. of deaths % of all deaths Rank Cause of Death • 1. Heart Diseases 652,486 27.2 • 2. Cancer553,888 23.1 • 3. Cerebrovascular diseases 150,074 6.3 • 4. Chronic lower respiratory diseases 121,987 5.1 • 5. Accidents (Unintentional injuries) 112,012 4.7 • 6. Diabetes mellitus 73,138 3.1 • 7. Alzheimer disease 65,965 2.8 • 8. Influenza & pneumonia 59,664 2.5 • 9. Nephritis 42,480 1.8 • 10. Septicemia 33,373 1.4 Source: US Mortality Public Use Data Tape 2004, National Center for Health Statistics, Centers for Disease Control and Prevention, 2006.
Change in the US Death Rates* by Cause, 1950 & 2004 Rate Per 100,000 1950 2004 HeartDiseases CerebrovascularDiseases Pneumonia/Influenza Cancer * Age-adjusted to 2000 US standard population. Sources: 1950 Mortality Data - CDC/NCHS, NVSS, Mortality Revised. 2004 Mortality Data: US Mortality Public Use Data Tape, 2004, NCHS, Centers for Disease Control and Prevention, 2006
Cancer Death Rates*, All Sites Combined, All Races, US, 1975-2003 Rate Per 100,000 Men Both Sexes Women *Age-adjusted to the 2000 US standard population. Source: Surveillance, Epidemiology, and End Results (SEER) Program (www.seer.cancer.gov) SEER*Stat Database: Mortality - All COD, Public-Use With State, Total U.S. (1969-2003), National Cancer Institute, DCCPS, Surveillance Research Program, Cancer Statistics Branch, released April 2006. Underlying mortality data provided by NCHS (www.cdc.gov/nchs).
Cancer Death Rates*, for Men, US,1930-2003 Rate Per 100,000 Lung & bronchus Stomach Prostate Colon & rectum Pancreas Leukemia Liver *Age-adjusted to the 2000 US standard population. Source: US Mortality Public Use Data Tapes 1960-2001, US Mortality Volumes 1930-1959, National Center for Health Statistics, Centers for Disease Control and Prevention, 2006.
Cancer Death Rates*, for Women, US,1930-2003 Rate Per 100,000 Lung & bronchus Uterus Breast Colon & rectum Stomach Ovary Pancreas *Age-adjusted to the 2000 US standard population. Source: US Mortality Public Use Data Tapes 1960-2001, US Mortality Volumes 1930-1959, National Center for Health Statistics, Centers for Disease Control and Prevention, 2006.
Cancer Death Rates* by Sex and Race, US, 1975-2001 Rate Per 100,000 African American men White men African American women White women *Age-adjusted to the 2000 US standard population. Source: Surveillance, Epidemiology, and End Results Program, 1975-2001, Division of Cancer Control and Population Sciences, National Cancer Institute, 2004.
Lifetime Probability of Developing Cancer, By Site, Men, US, 1999-2001 Site Risk All sites 1 in 2 Prostate 1 in 6 Lung and bronchus 1 in 13 Colon and rectum 1 in 17 Urinary bladder 1 in 28 Non-Hodgkin lymphoma 1 in 46 Melanoma 1 in 53 Kidney 1 in 67 Leukemia 1 in 68 Oral Cavity 1 in 73 Stomach 1 in 81 Source: DevCan: Probability of Developing or Dying of Cancer Software, Version 5.2 Statistical Research and Applications Branch, NCI, 2004. http://srab.cancer.gov/devcan
Lifetime Probability of Developing Cancer, By Site, Women, US, 1999-2001 Site Risk All sites 1 in 3 Breast 1 in 7 Lung & bronchus 1 in 18 Colon & rectum 1 in 18 Uterine corpus 1 in 38 Non-Hodgkin lymphoma 1 in 56 Ovary 1 in 68 Melanoma 1 in 78 Pancreas 1 in 81 Urinary bladder 1 in 88 Uterine cervix 1 in 130 Source:DevCan: Probability of Developing or Dying of Cancer Software, Version 5.2 Statistical Research and Applications Branch, NCI, 2004. http://srab.cancer.gov/devcan
Five-year Relative Survival (%)* during Three Time Periods By Cancer Site Site 1975-1977 1984-1986 1996-2002 • All sites 50 53 66 • Breast (female) 75 79 89 • Colon 51 59 65 • Leukemia 35 42 49 • Lung and bronchus 13 13 16 • Melanoma 82 86 92 • Non-Hodgkin lymphoma 48 53 63 • Ovary 37 40 45 • Pancreas 2 3 5 • Prostate 69 76 100 • Rectum 49 57 66 • Urinary bladder 73 78 82 † *5-year relative survival rates based on follow up of patients through 2003. †Recent changes in classification of ovarian cancer have affected 1996-2002 survival rates. Source: Surveillance, Epidemiology, and End Results Program, 1975-2003, Division of Cancer Control and Population Sciences, National Cancer Institute, 2006.