Download
1 / 21
210 likes | 320 Views
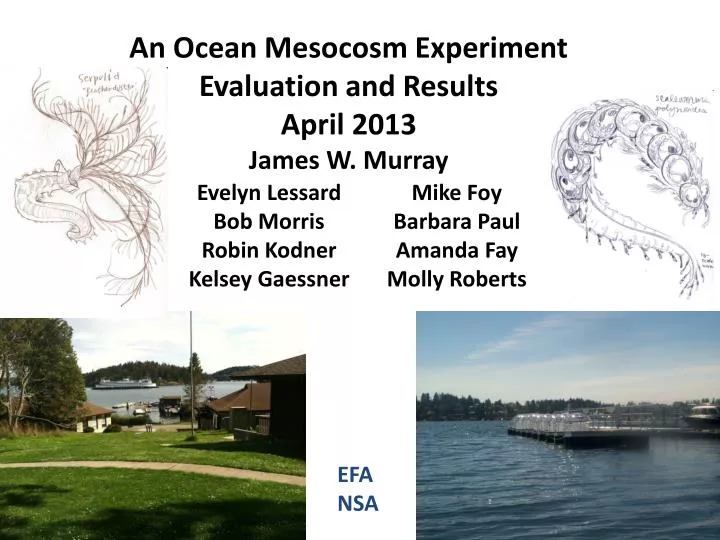
An Ocean Mesocosm Experiment Evaluation and Results April 2013 James W. Murray. Evelyn Lessard Bob Morris Robin Kodner Kelsey Gaessner Mike Foy Barbara Paul Amanda Fay Molly Roberts. EFA NSA. Ocean Acidification impacts on ecosystems Goals: How does chemistry and biology change:

E N D
An Ocean Mesocosm Experiment Evaluation and Results April 2013 James W. Murray Evelyn Lessard Bob Morris Robin Kodner Kelsey Gaessner Mike Foy Barbara Paul Amanda Fay Molly Roberts EFA NSA
Ocean Acidification impacts on ecosystems Goals: How does chemistry and biology change: with time during bloom conditions? with CO2levels?
As seen from Google Earth (like the Great Wall) The mesocosm dock with its space age domes is circled.
FHL is an HNLC Ocean Area (NO3 = 25 mM; PCO2 = 650 matm) The high nutrient and CO2 water is of natural origin. Source is the California Undercurrent. Rich Thomson (IOS)
April 2012 Experiment Effect of CO2 amendments obscured by a dramatic biological bloom. Need to try something new!
Nine Mesocosms Polyurethane bags (commercially sealed) Total Length = 6m Length in water = 5m Diameter = 1m Nominal volume = 3500 ltr Mesocosm Frames Each with its own flotation
Mesocosms filled from a common reservoir filled with coarsely filtered seawater
Two important changes from 2012 Experiment Light reduction –to slow biology CO2 Control – the master variable
Experiment Time Points Filled mesocosms with filtered (0.5 mm) seawater at ~1 ltr min-1 Friday April 5 to Monday April 8 (50 hours) April 8 – added 15 ltr of 4M NaCl to each bag Measured salinity before and after to calculate volume Added CO2 saturated SW to make six @ 1250 μatm Controls at 650 μatm; High at 1250 μatm; Drift at 1250 μatm but no CO2 control Sampled daily for 21 days starting at 800AM. T0 sampling day on Tuesday April 9. T10 (April 19) Top screens removed. Side screens lowered T21 April 30 – last day of sampling
There were cloudy days and sunny days (especially just after T10!
Bag Volume (L) 1 3378 2 2881 3 3041 4 3411* 5 2892 6 2396* 7 2711 8 3020 9 3119 Average = 2983 ± 316 L
106 CO2 + 16 HNO3+ H3PO4 + 122 H2O + trace elements (e.g. Fe) (CH2O)106(NH3)16(H3PO4) + 138 O2
Ocean 492 – Ocean Acidification Apprenticeship Spring 2013 Porcino, Natsuko"chlorophylland phytoplankton community changes in a shifting CO2 environment" Stephens, Amy"Phytoplankton Community and Abundance in High CO2 Conditions" Shutt, Kiely "DiatonSilicification changes in a high pCO2 environment: a mesocosm experiment" Newcomb, Daneil"Transparent exopolymer particle production under ocean acidification conditions: a mesocosm study" Baird, Andrew"Constraining Primary Production within a pCO2 Manipulation Mesocosm Experiment" Gravinese, Philip"The effects of elevated pCO2 on microzooplankton: a mesocosm approach" Govenar, Kelly"Phytoplankton Growth and Microzooplankton Grazing with Increased CO2 Levels“ • Apple, Jennifer “Effects of CO2 Manipulation on Heterotrophic • Bacterioplankton: A mesocosm study”
Conclusions: 1. Biological Production is limited by nutrients and light. We can control the light to slow biology. Our strategy worked. 2. CO2 is a master variable in OA experiments and should be kept constant.Our DIC addition techniques were successful. In this experiment we had mesocosms called: Control = 650 matm High = 1250 matm Drift = 1250 matm to 500 matm 3. The results reflect two phases to the experiment T0 to T10 slower biological production T10 to T21 faster biological production 4. Many of the results are “first time” data for the FHL dock