Download
1 / 20
220 likes | 595 Views
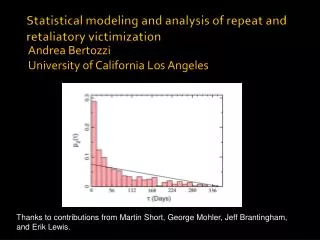
Analysis of Alu repeat elements. Molecular biology & Phylogeny Laboratory Woo-Yeon Kim. CONTENTS. Whole-genome analysis of Alu repeat elements reveals complex evolutionary history INTRODUCTION NEW IDEAS RESULTS DISCUSSIONS

E N D
Analysis of Alu repeat elements Molecular biology & Phylogeny Laboratory Woo-Yeon Kim
CONTENTS • Whole-genome analysis of Alu repeat elements reveals complex evolutionary history • INTRODUCTION • NEW IDEAS • RESULTS • DISCUSSIONS • Alu repeat analysis in the complete human genome: trends and variations with respect to genomic composition
Genome Research - Letter Supplemental material is available online at www.genome.org
L R Poly A signal Poly A signal AAAAA AAAAA Alu repeats • A family of SINEs, short interspersed nuclear elements • Replicating via LINE-mediated reverse transcription of an RNA polymerase Ⅲ transcript • Roughly 280 bp • The history of substitution patterns in the human genome • Markers to determine genetic distances between human subpopulations – polymorphic Alu insertions SINE Structure
K-means • Place K points into the space represented by the objects that are being clustered. These points represent initial group centroids. • Assign each object to the group that has the closest centroid. • When all objects have been assigned, recalculate the positions of the K centroids. • Repeat Steps 2 and 3 until the centroids no longer move. This produces a separation of the objects into groups from which the metric to be minimized can be calculated.
An example using real data • Only the 5 Alu positions with diagnostic mutations in the Ya5 subfamily (position 91, 98, 146, 175, and 238) • Applying k-means clustering, k = 2
Looking for overrepresented pairs • Identifying nested subfamilies • Computing biprofiles, frequencies of pairs of nucleotide values
Aligned consensus sequences of selected subfamilies • Roughly 480,000 full-length Alu elements • Recursively split subfamilies • Identifying 213 subfamilies
DISCUSSION • Significant mutation from the consensus sequence • Available detected by a rigorous whole-genome analysis • Partial results • Not statistically discernible • Limitations in this algorithm • Limitations – Excluding • Insertion/deletion mutations • Frequent CpG mutations • Mutations to nucleotide values already present in other subfamilies • Statistically distinguishable subfamilies • Only 19 of the 31 subfamilies currently reported in Repbase Update
Bioinformatics – Discovery Note Online Supplementary data is available at the web page www.igib.res.in/manuscriptdata/aluanalysis.html
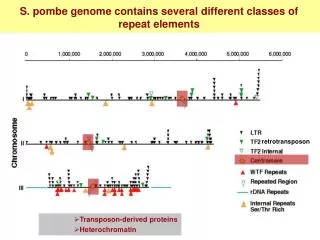
Alu distribution in whole genome Fig.1. (a) Number of Alu repeats in different chromosomes in human genome with vertical segments representing the numbers corresponding to each Alu subfamily
Alu repeat density and association with genes Fig. 1. (b) Variation in Alu and gene densities in human genome
Alu in intergenic and intragenic regions Variation in Alu contents in Genes of human Genome Alu densities in the intergenic and intragenic regions in human genome
Distribution of Alu subfamilies • The most abundant Alu subfamily – AluS, 6.4 % region of the genome • Chromosome Y • The most Alu poor chromosome • High density Alu Y – very low density Alu S, Alu J • Chromosome 13, 9 – similar trend • 13 having least density of Alu J • Chromosome 8, X • High density Alu S, J • Very low density Alu Y
Correlation analysis GC content seems to have highest association with Alu density overall, followed by gene density and intron density
DISCUSSION • Analysis of Alu distribution in genes • Statistically significant correlation between Alu and gene densities • A higher Alu density in intragenic regions – These elements are preferred in genes. • The highest Alu and gene densities – Chromosome 19, 22 • Alu density is correlated in the order GC content > gene density > intron density • The abundance of Alu subfamilies – Alu S > Alu J > Alu Y • Young subfamilies - Chromosome 9, 13 and Y • Old subfamilies – Chromosome 8 and X • Higher correlation of older Alus with GC content than younger ones