Download
1 / 14
140 likes | 147 Views
M3M8D4. Homework, graphing calculator, Pencil, red pen, highlighter. Have out:. Bellwork:. 1. Draw and label a normal distribution curve, to 3 standard deviations, of an: a) IQ test with a mean of 100 and a standard deviation of 15 .

E N D
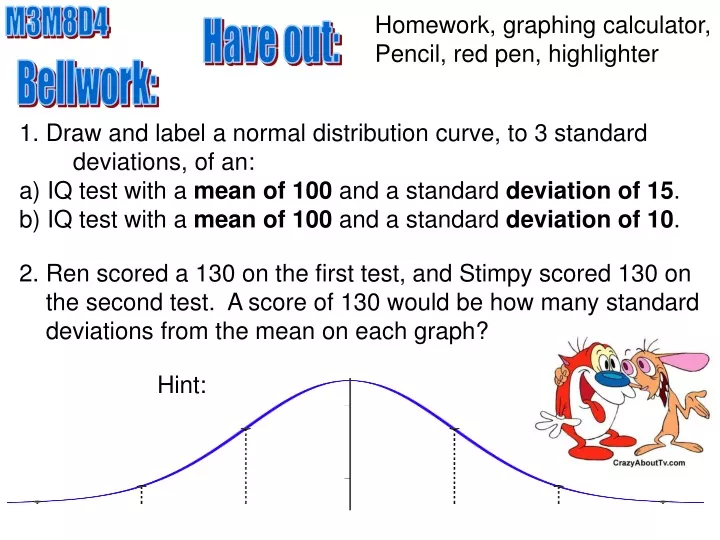
M3M8D4 Homework, graphing calculator, Pencil, red pen, highlighter Have out: Bellwork: 1. Draw and label a normal distribution curve, to 3 standard deviations, of an: a) IQ test with a mean of 100 and a standard deviation of 15. b) IQ test with a mean of 100 and a standard deviation of 10. 2. Ren scored a 130 on the first test, and Stimpy scored 130 on the second test. A score of 130 would be how many standard deviations from the mean on each graph? Hint:
a) 130 +7 labeled graph 55 85 70 100 145 130 115 b) • Ren’s IQ is 2 standard deviations from the mean. +1 +7 labeled graph Stimpy’s IQ is 3 standard deviations. +1 70 90 80 110 100 130 120 Notice one curve is wider and shorter than the other Notice that the same score is a different number of standard deviations away from the mean. Normal curve animation
Outliers and Z-scores Example #1: A college entrance exam has a mean score of 520 and a standard deviation of 100. Bobby scored a 670 on the exam. Label , , , and 220 420 320 620 520 820 720 Duhhh, I can help. 670 How many standard deviations is Bobby’s score from the mean? Shut up you idiot! Let the teacher teach! Any guesses? More than one… less than 2...
220 420 320 620 520 820 720 It is often useful to know how many standard deviations a data point is above or below the mean. This is called the ________. z–score Mean Z = _________ of the data. standard deviation _________ _________ of the data. 520 670 – 150 1.5 = = ____ Determine Bobby’s z–score. Z = 100 100 1.5 above Therefore, Bobby scored _____ standard deviation _______ the mean.
220 420 320 620 520 820 720 –3 –2 –1 0 1 3 2 670 Label the z–scores on your graph. 1.5 Z–score is the number of standard deviations above or below the mean
Example #2: Using the information from the previous problem, determine the z–score for each person’s exam. 470 – 520 595 – 520 300 – 520 720 – 520 520 – 520 100 100 100 100 100 –50 75 –220 200 0 = = = = = 100 100 100 100 100 = –0.5 = 0.75 = –2.2 = 2 = 0 Judy: 0.75 Fred: -0.5 Jessica: 0 Jim: -2.2 Patty: 2 220 420 320 620 520 820 720 –3 –2 –1 0 1 3 2
Jessica: 0 Fred: -0.5 Jim: -2.2 Judy: 0.75 Patty: 2 220 420 320 620 520 820 720 –3 –2 –1 0 1 3 2 Jim Who is the farthest from the mean? ___________ Scores above the mean have __________ z–scores. Scores below the mean have __________ z–scores. A score equal to the mean has a z–score of ______. positive negative 0
Example #3: The times (in seconds) for a PE class to run the ¼ mile are listed below. Record the times into L1. First, determine 75 = ______ and = ______, then label 11.72 , , , and below. 39.84 51.56 63.28 75 86.72 98.44 110.16 –3 –2 –1 0 1 2 3 TIMES: 58, 102, 65, 70, 68, 75, 81, 84, 79, 68
L2 Find the z–score for each time using LIST ALGEBRA. –1.45 2.30 Use: 1–variable statistics: –0.85 STAT CALC 1–VAR STATS –0.43 –0.597 0 LIST MATH MEAN ( … 0.51 vars 5:statistics 4: σx STO 0.77 0.34 L2 –0.597
Which student is the farthest from the mean? L2 #2 –1.45 Student # ___ is _____ standard deviations ______ the mean. 2 2.3 2.30 above However, in this case, above the mean is _____ desirable. –0.85 not –0.43 Outliers - Generally, if a point is more than ___ standard deviations above or below the mean, it is considered an _________. –0.597 2 0 outlier 0.51 Is this student an outlier? 0.77 Yes, the student is more than 2 standard deviations from the mean. 0.34 –0.597
Practice: 1. Mrs. Windham gave a test in her Algebra 2 class. The scores were normally distributed with a mean of 80 and a standard deviation of 7. Label , , and . , 59 66 73 80 87 94 101 –3 –2 –1 0 1 2 3 a) If Melissa has a raw score of 92, what is her z–score? b) If Aiden has a raw score of 71, what is his z–score? c) If Malique has a raw score of 60, what is his z–score? 92 – 80 71 – 80 60 – 80 7 7 7 12 -9 -20 = = = ≈ 1.71 ≈ –1.29 ≈ –2.86 7 7 7
59 66 73 80 87 94 101 –3 –2 –1 0 1 2 3 d) Lee’s z–score was 1.43. Find his raw score on the test. e) Amanda’s z–score was –0.72. Find her raw score on the test. – 80 x – 80 x 1.43 = –0.72 = 7 7 x – 80 = 7(–0.72) x – 80 = 7(1.43) x – 80 = –5.04 x – 80 = 10.01 x = 74.96 x = 90.01 x ≈ 90 x ≈ 75 f) Which students are outliers in the above problem? Malique is an outlier since he is 2σfrom the mean.
Graph A Graph B 2. The mean for each normal curve is given below, but the standard deviation is not given. Based on the graphs, how do the standard deviations compare between both graphs? The standard deviation is greater in Graph B than in Graph A. A larger standard deviation “stretches” the graph. We can also say that the data in Graph B is more spread out than in Graph A.
Here is your assignment! TAKE HOME QUIZ #1 DUE tomorrow!