Download
1 / 1
10 likes | 84 Views
SHAPE ANALYSIS OF THE LEFT VENTRICULAR ENDOCARDIAL SURFACE FOR DETECTION OF CORONARY ARTERY DISEASE Anirban Mukhopadhyay , Ph.D. Student Visual and Parallel Computing Laboratory Department of Computer Science The University of Georgia anirba@cs.uga.edu.

E N D
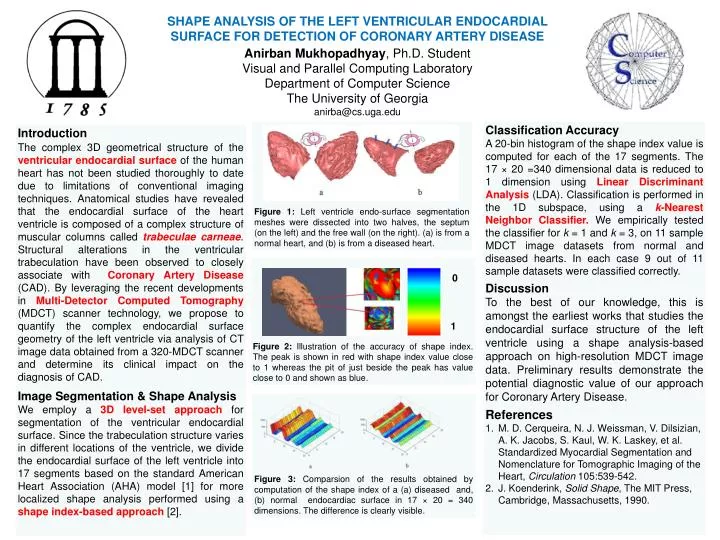
SHAPE ANALYSIS OF THE LEFT VENTRICULAR ENDOCARDIAL SURFACE FOR DETECTION OF CORONARY ARTERY DISEASE AnirbanMukhopadhyay, Ph.D. Student Visual and Parallel Computing Laboratory Department of Computer Science The University of Georgia anirba@cs.uga.edu Figure 1: Left ventricle endo-surface segmentation meshes were dissected into two halves, the septum (on the left) and the free wall (on the right). (a) is from a normal heart, and (b) is from a diseased heart. • Classification Accuracy • A 20-bin histogram of the shape index value is computed for each of the 17 segments. The 17 × 20 =340 dimensional data is reduced to 1 dimension using Linear Discriminant Analysis (LDA). Classification is performed in the 1D subspace, using ak-Nearest Neighbor Classifier. We empirically tested the classifier for k = 1 and k = 3, on 11 sample MDCT image datasets from normal and diseased hearts. In each case 9 out of 11 sample datasets were classified correctly. • Discussion • To the best of our knowledge, this is amongst the earliest works that studies the endocardial surface structure of the left ventricle using a shape analysis-based approach on high-resolution MDCT image data. Preliminary results demonstrate the potential diagnostic value of our approach for Coronary Artery Disease. • References • M. D. Cerqueira, N. J. Weissman, V. Dilsizian, A. K. Jacobs, S. Kaul, W. K. Laskey, et al. Standardized Myocardial Segmentation and Nomenclature for Tomographic Imaging of the Heart, Circulation 105:539-542. • J. Koenderink, Solid Shape, The MIT Press, Cambridge, Massachusetts, 1990. Introduction The complex 3D geometrical structure of the ventricular endocardial surface of the human heart has not been studied thoroughly to date due to limitations of conventional imaging techniques. Anatomical studies have revealed that the endocardial surface of the heart ventricle is composed of a complex structure of muscular columns called trabeculaecarneae. Structural alterations in the ventricular trabeculation have been observed to closely associate with Coronary Artery Disease (CAD). By leveraging the recent developments in Multi-Detector Computed Tomography(MDCT) scanner technology, we propose to quantify the complex endocardial surface geometry of the left ventricle via analysis of CT image data obtained from a 320-MDCT scanner and determine its clinical impact on the diagnosis of CAD. Image Segmentation & Shape Analysis We employ a 3D level-set approach for segmentation of the ventricular endocardial surface. Since the trabeculation structure varies in different locations of the ventricle, we divide the endocardial surface of the left ventricle into 17 segments based on the standard American Heart Association (AHA) model [1] for more localized shape analysis performed using a shape index-based approach [2]. Figure 2: Illustration of the accuracy of shape index. The peak is shown in red with shape index value close to 1 whereas the pit of just beside the peak has value close to 0 and shown as blue. 0 1 Figure 3: Comparsion of the results obtained by computation of the shape index of a (a) diseased and, (b) normal endocardiac surface in 17 × 20 = 340 dimensions. The difference is clearly visible.


