Download
1 / 14
140 likes | 311 Views
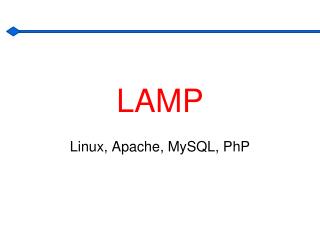
Depicting LAMP probabilities and uncertainty in best category forecast N ew LAMP web page product Judy E. Ghirardelli Scott Scallion National Weather Service Meteorological Development Laboratory. How we make our “best category” selection in LAMP. Development:

E N D
Depicting LAMP probabilities and uncertainty in best category forecast New LAMP web page product Judy E. Ghirardelli Scott Scallion National Weather Service Meteorological Development Laboratory
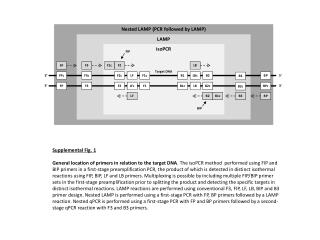
How we make our “best category” selection in LAMP • Development: • Thresholds are statistically developed by one of two techniques, either: • Targeting unit bias (forecast the event as often as it occurs), or • Maximizing the threat score within a bias range • Thresholds vary by region, start time, projection, element, category, etc. • Implementation: • LAMP compares the probability of the category to the threshold for the category • LAMP starts with the rarest category and goes to the most common category • The first category whose probability exceeds its threshold is the chosen category
LAMP Categorical Forecast Selection Process The probability of “few” exceeds the threshold value for “few” – therefore LAMP categorical forecast is “few” Does the probability equal or exceed the threshold? Does the probability equal or exceed the threshold? Does the probability equal or exceed the threshold? Does the probability equal or exceed the threshold? YES Probability (%) NO NO NO Category 1 Category 2 Category 3 Category 4 Category 5
Depicting Probabilistic Information Take the “simple” example of Probability of Precipitation, which is a yes/no decision. If the probability exceeds the threshold, then the category chosen is “yes.” If not, the category chosen is “no.”
Chicago – slight chance yes and slight chance no precip Depicting Probabilistic Information Purpose: indicate to user the uncertainty associated with the Best Category forecasts given the probabilistic information Threshold = dashed black line Probability < thres = green line Probability ≥ thres = red line San Francisco – very small chance of precip St. Louis – slight chance of precip St. Cloud – high chance of precip
Depicting Probabilistic Information Now take the more complicated example of visibility, which has multiple categories to choose.
LAMP Probabilities and Thresholds for Flight Categories Threshold Plot Tab Look at rarest of these categories first. The probability of vis < 1 mile (solid line) does not exceed the threshold (dashed line). Look to next rarest category.
LAMP Probabilities and Thresholds for Flight Categories Threshold Plot Tab Look at next rarest of these categories. The probability of vis < 3 miles (solid line) exceeds the threshold (dashed line) only for the last hour; therefore this condition is indicated for only that hour. Look to next rarest category to determine the conditions for other hours.
LAMP Probabilities and Thresholds for Flight Categories Threshold Plot Tab Look at next rarest of these categories. The probability of vis ≤ 5 miles (solid line) DOES exceed the threshold (dashed line) at times; therefore this condition is indicated for those times. Note that vis ≤ 5 is not chosen for the last hour, because a rarer condition (vis < 3 miles) was already indicated.
LAMP Probabilities and Thresholds for Flight Categories Threshold Plot Tab Show all together. Looking at these categories, look at the rarest first, then the next rarest, etc. The condition indicated is the rarest probability which exceeds its threshold. This is indicated by the red probability line.
Depicting Probabilistic Information In addition to the previous kinds of plots, we are also offering a web page that shows one category’s probability and threshold at a time, and color codes the confidence in choosing that category by indicating how close the probability was to the threshold. One would have more confidence in a chosen category if the probability exceeded the threshold by a large amount, compared to the probability just barely exceeding the threshold.
LAMP Probabilities and Thresholds for Flight Categories Uncertainty Plot Tab – looking at vis ≤ 5 miles Red=YesProbability exceeds threshold by more than 10% Orange=LikelyProbability exceeds threshold but NOT by more than 10% Yellow = ChanceProbability is less than threshold but within 10% Cyan = NoProbability is less than threshold by more than 10% Note that this shows you one condition (e.g., vis ≤ 5 miles). To determine the most likely condition, you should consider the rarest conditions first.
Depicting Probabilistic Information • New LAMP web pages coming soon: • Uncertainty plots - station selection page: • http://weather.gov/mdl/gfslamp/uncertform.php • Accessible from the main GFS-LAMP Realtime Products page: • http://weather.gov/mdl/gfslamp/gfslamp.shtml • Uncertainty plots - direct access: • http://weather.gov/mdl/gfslamp/uncertplots.php • Threshold plots - direct access: • http://weather.gov/mdl/gfslamp/threshplots.php
Depicting Probabilistic Information • Documentation on the new page: • http://weather.gov/mdl/gfslamp/docs/uncertplots_info.shtml • For questions or comments, contact: • Judy.Ghirardelli@noaa.gov (LAMP Task Leader) • Scott.Scallion@noaa.gov (LAMP Developer and Web Master)