Download
1 / 13
130 likes | 140 Views
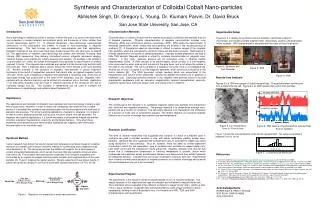
In the present investigation, photocatalytic degradation of Erythrosine B dye has been studied using nano-sized semiconducting barium chromate powder. The semiconductor was prepared by precipitation method and it was characterized by different analytical techniques like XRD, SEM-EDS and FT-IR. Barium chromate absorbs major portion of visible light due to its yellow color and acts as an efficient photocatalyst. The effects of various operating parameters like pH, concentration of dye, amount of semiconductor and light intensity on the rate of dye degradation have been observed. Physico-chemical parameters of the dye (before and after) have also been reported to show the degradation of dye molecules in the aqueous solution.

E N D
Int. J. Chem. Sci.: 14(4), 2016, 2553-2565 ISSN 0972-768X www.sadgurupublications.com SYNTHESIS, CHARACTERIZATION AND APPLICATION OF NANO-SIZED BARIUM CHROMATE FOR DEGRADATION OF ERYTHROSINE B RAKSHIT AMETAa* and DINESH I. PRAJAPATIb aDepartment of Chemistry, PAHER University, UDAIPUR – 313003 (Raj.) INDIA bDepartment of Chemistry, M. G. Science Institute, AHMEDABAD – 380009 (Guj.) INDIA ABSTRACT In the present investigation, photocatalytic degradation of Erythrosine B dye has been studied using nano-sized semiconducting barium chromate powder. The semiconductor was prepared by precipitation method and it was characterized by different analytical techniques like XRD, SEM-EDS and FT-IR. Barium chromate absorbs major portion of visible light due to its yellow color and acts as an efficient photocatalyst. The effects of various operating parameters like pH, concentration of dye, amount of semiconductor and light intensity on the rate of dye degradation have been observed. Physico-chemical parameters of the dye (before and after) have also been reported to show the degradation of dye molecules in the aqueous solution. Key words: Photocatalytic degradation, Semiconductor, Erythrosine B, Barium chromate. INTRODUCTION Now-a-days, environmental pollution is a burning problem all over the globe in its various facets. Out of which, water pollution is a major problem, as potable water is a basic need of everyone. Dye pollutants from various dyeing, printing and textile industries pollute the near by natural water resources, as the effluents are discharged without proper treatment. The colored waste waters create many environmental and public health issues. The waste waters containing dyes may cause skin cancer due to photosensitization and photodynamic action. On the other hand, bleached or degraded water containing dye is less toxic, harmless and may be used for irrigation, washing, cleaning and other purposes. Hence, there is an urgent need to search eco-friendly methods for waste water treatment. There are various techniques to remove water pollutants like biological method, air stripping, adsorption, osmosis, flocculation and membrane filtration etc. Each of these processes has some ________________________________________ *Author for correspondence; E-mail: rakshit_ameta@yahoo.in
R. Ameta and D. I. Prajapati: Synthesis, Characterization and…. 2554 advantages as well as its own disadvantages. Photocatalysis is a newer and developing technology for waste water treatment. It is also a green chemical and low cost method to solve this problem. Hong et al.1 synthesized ZnO nanoparticles by precipitation method and used it for degradation of methyl orange while Byrappa et al.2 studied photocatalytic degradation of rhodamine B using hydrothermally prepared ZnO as photocatalyst. Photocatalytic degradation of textile dye procion yellow was investigated by Ram et al.3 using TiO2 nanocatalyst where as the photocatalytic decolorization of rose Bengal dye was examined by Kumawat et al.4 in presence of zinc oxide semiconducting powder. Lim et al.5 synthesized CdSe-TiO2 photocatalyst using a facile solvothermal method and tested its photocatalytic efficiency for the degradation of methylene blue under UV and visible light. Vijay et al.6 investigated the photocatalytic efficiency of WO3 as photocatalyst for photocatalytic degradation of azure B dye. Photocatalytic degradation of an azo dye direct red 31 was studied by Rao et al.7 using ZnS photocatalyst while Chen et al.8 synthsized nano-sized ZnO catalysts by precipitation method and used it for degradation of methyl orange dye. Giwa et al.9 investigated photocatalytic bleaching of a textile dye–C.I. basic blue 41 using TiO2 nanoparticles. ZnWO4 catalyst has been synthesized by Fu et al.10 using hydrothermal crystallization method and the sample showed high photocatalytic activity for the degradation of rhodamine B and formaldehyde. Ai et al.11 prepared carbon nanotubes with attached ZnS nanocrystals and used it for degradation of methylene blue. The nanosized CeNiO3 powder has been synthesized by Bhati et al.12 and fast green dye was successfully degraded by CeNiO3. Sharma et al.13 have used semiconducting bismuth sulfide as a photocatalyst for degradation of rose Bengal. Zhang and Zhu14 reviewed photocatalytic activity and improvement of Bi2WO6 nanoplates using methylene blue while removal of methyl orange was studied by Sharma et al.15 using crystalline iron oxide. Yan et al.16 synthesized monoclinic and tetragonal CdWO4 polymorphs and found these photocatalyst good for the photodegradation of methyl orange where as the photocatalytic mineralization of phenol has been carried out by Zhang et al.17 in presence of BiPO4 photocatalyst under UV irradiation. In the present work, barium chromate has been used for photocatalytic degradation of erythrosine B. It was found a good photocatalyst in the visible region due to its yellow colour.
Int. J. Chem. Sci.: 14(4), 2016 2555 EXPERIMENTAL Reagents and apparatus K2CrO4, BaCl2, Erythrosine B, NaOH and H2SO4 (Himedia) were used as received. The molecular formula of Erythrosine B is C20H6I4Na2O5 and its mol. wt. is 879.86 g mol-1. COONa I I NaO O O I I Fig. 1: Chemical structure of Erythrosine B Preparation of nano-sized barium chromate semiconductor Barium chromate photocatalyst was prepared using K2CrO4 and BaCl2 through precipitation method. 100 mL 5% aqueous solution of BaCl2 was mixed with 100 mL 5% aqueous solution of K2CrO4 with constant stirring. The resulting precipitate of BaCrO4 was allowed to settle down. The product was filtered, washed with double distilled water several times and dried at 60°C in oven. Procedures A stock solution of Erythrosine B (1.0 × 10⁻³ M) was prepared in doubly distilled water and it was diluted further as and when required. The optical density of Erythrosine B solution was determined with the help of a spectrophotometer (Systronics Model 106) at λmax = 520 nm. Erythrosine B dye has been used as a model system in the present work to study the photocatalytic activity of barium chromate. The dye solution was divided into four beakers and control experiments were carried out to confirm the application of barium chromate (BaCrO4) as a photocatalyst. The first beaker containing Erythrosine B solution was kept in dark; the second beaker containing Erythrosine B solution was exposed to the light of a 200 W tungsten lamp; the third beaker containing Erythrosine B solution and 0.10 g BaCrO4 was kept in dark, and the fourth beaker containing Erythrosine B solution and 0.10 g BaCrO4 was exposed to light.
R. Ameta and D. I. Prajapati: Synthesis, Characterization and…. 2556 After keeping all these beakers for 3-4 hours, the absorbance of the solution in each beaker was measured with the help of a spectrophotometer. It was found that the absorbance of solutions of first three beakers remained almost constant, while the solution of fourth beaker had a decrease in the value of its optical density as compared to its initial value. From these observations, it becomes clear that this reaction requires presence of both; light and the semiconductor BaCrO4. Hence, this reaction is photocatalytic in nature. Characterization XRD X-ray diffraction studies of the sample were conducted using PANalytical, Singapore make, XPERT-PRO model with Cu Kα radiation (λ = 1.54060 A°, 2Ө = 10 to 80° with generator setting 40 mA, 45 kV). Diffraction pattern was taken over the 2θ range 10º- 70º. Fig. 2 shows the XRD pattern of synthesized nano-particles of BaCrO4. It was observed that all the diffraction peaks were similar to that of orthorhombic phase of BaCrO4 (JCPDS- 15-376, lattice constants, a = 8.2026°, b = 8.2026°, c = 13.6302° A). The particle size of the synthesized barium chromate was calculated using Sherrer formula (Eq. 1) and it was found as 14.71 nm. D = Kλ / β cosθ …(1) Where K is a constant, which depends on the shape of the crystal and its value is 0.9 assuming spherical shape; λ is the wavelength; D is the crystallite size; β is full width of half maxima (FWHM) value (calculated for the XRD pattern) and θ is Bragg’s angle. Fig. 2: XRD of barium chromate semiconductor
Int. J. Chem. Sci.: 14(4), 2016 2557 SEM-EDS analysis Scanning electron microscopy studies of the sample were conducted using JEOL, Japan make, 5610LV model. It was operated at 15 kV. SEM-EDS of barium chromate is given in Fig. 3. Fig. 3: SEM-EDS of barium chromate SEM of the synthesized semiconductor indicates that particles are unevenly distributed in size and EDS gives clearly that the catalyst contains only barium, chromium and oxygen only and it does not have any impurity. FT-IR Fourier transform-infrared (FT-IR) spectrum of BaCrO4 was taken by Shimadzu, IR Affinity, using KBr disk method and it is shown in Fig. 4. Fig. 4: FT-IR of barium chromate
R. Ameta and D. I. Prajapati: Synthesis, Characterization and…. 2558 FT-IR spectrum of BaCrO4 nano-particles shows the characteristic absorption bands of chromate group located at 875, 894 and 952 cm-1 and it also confirms bonding between chromium and oxygen. RESULTS AND DISCUSSION A solution of 3.0 × 10⁻⁵ M of Erythrosine B was prepared in doubly distilled water and 0.10 g of BaCrO4 was added to it. The pH of the reaction mixture was adjusted to 8.0 with the help of previously standardized sodium hydroxide and sulphuric acid solutions. Then the solution was exposed to a 200 W tungsten lamp. An aliquot of 2.0 mL was taken out from the reaction mixture and its absorbance was observed at 520 nm at regular time intervals. It was observed that the absorbance of Erythrosine B solution was found to decrease with the increase in the time of exposure. The typical run for the photocatalytic degradation of Erythrosine B in presence of barium chromate semiconductor has been presented in Table 1 and graphically represented in Fig. 5. Table 1: A typical run Time (min) 0.0 Absorbance (A) 1 + log A 0.67 0.8261 20.0 0.63 0.7993 40.0 0.59 0.7709 60.0 0.55 0.7404 80.0 0.51 0.7076 100.0 0.48 0.6812 120.0 0.45 0.6532 140.0 0.41 0.6128 160.0 0.39 0.5911 180.0 0.36 0.5563 200.0 0.33 0.5185 220.0 0.31 0.4914 240.0 0.29 0.4624 pH = 8.0. [Erythrosine- B] = 3.0 × 10 -5 M. BaCrO4 = 0.10 g. Light intensity = 80.0 mWcm-2
Int. J. Chem. Sci.: 14(4), 2016 2559 0.9 0.8 0.7 0.6 1 + log A 0.5 0.4 0.3 0.2 0.1 0 0 20 40 60 80 100120 140 160180 200 220 240 Time (min) Fig. 5: Typical run for degradation of Erythrosine B The plot of 1 + log A against time was found to be linear. Hence, it was confirmed that the photocatalytic degradation of Erythrosine B follows pseudo-first order kinetics. The rate constant of this reaction was determined with the expression; k = 2.303 × slope and it was obtained as 5.97 × 10⁻⁵ sec-1. Effect of pH The pH of the solution affects the degradation rate of the dye and therefore, the photocatalytic degradation of Erythrosine B was studied in the pH range 5.0–10.0. The results are summarized in Table 2. Table 2: Effect of pH k × 105 (sec -1) pH 5.0 2.13 5.5 2.50 6.0 3.21 6.5 3.57 7.0 4.22 7.5 5.19 8.0 5.97 8.5 4.86 Cont…
R. Ameta and D. I. Prajapati: Synthesis, Characterization and…. 2560 k × 105 (sec -1) pH 9.0 3.93 9.5 3.64 10.0 3.10 [Erythrosine- B] = 3.0 × 10 -5 M. BaCrO4 = 0.10 g. Light intensity = 80.0 mWcm-2 It has been observed that the rate of photocatalytic degradation of Erythrosine B was increased with increase in pH upto 8.0. The increase in the rate of photocatalytic degradation may be due to more availability of the OH– ions at higher pH values. OH– ions will generate more •OH radicals by combining with the holes (h+) of semiconductor. These •OH radicals are considered responsible for the photocatalytic degradation of the dye molecules. But after a certain value of pH i.e. 8.0, a further increase in pH of the medium decreases the rate of photocatalytic degradation of dye. It may be due to the fact that Erythrosine B does not remain in its cationic form due to greater concentration of OH– ions and as such, there is no attraction between neutral dye molecules and negatively charged semiconductor surface. As a result, the reaction rate decreases. Effect of Erythrosine B concentration The effect of dye concentration on the rate of photocatalytic degradation was studied by taking different concentration of Erythrosine B. The results are tabulated in Table 3. Table 3: Effect Erythrosine B concentration [Erythrosine B] × 105 M k × 105 (sec -1) 2.7 4.72 2.8 4.98 2.9 5.33 3.0 5.97 3.1 5.20 3.2 4.24 3.3 3.63 pH = 8.0. BaCrO4 = 0.10 g. Light intensity = 80.0 mWcm-2
Int. J. Chem. Sci.: 14(4), 2016 2561 It has been observed that the rate of photocatalytic degradation was increased with an increase in the concentration of the Erythrosine B upto 3.0 x 10⁻⁵ M. This may be attributed to the fact that as the concentration of Erythrosine B was increased, more dye molecules were available for excitation followed by inter system crossing and energy transfer and hence, an increase in the rate was observed. The rate of photocatalytic degradation was found to decrease with a further increase in the concentration of the dye. This may be attributed to the fact that the after this concentration, dye will start acting as a filter for the incident light and it will not permit the desired light intensity to reach the semiconducting particles; thus, decreasing the rate of photocatalytic degradation of the dye. Effect of amount of photocatalyst The rate of photocatalytic degradation of dye is also affected by the amount of semiconductor and hence, different amounts of semiconductor were used. The results are summarized in Table 4. Table 4: Effect of amount of photocatalyst k × 105 (sec -1) BaCrO4 (g) 0.02 2.86 0.04 3.57 0.06 3.92 0.08 4.67 0.10 5.97 0.12 5.98 0.14 5.97 0.16 5.96 pH = 8.0. [Erythrosine- B] = 3.0 × 10 -5 M. Light intensity = 80.0 mWcm-2 It has been observed that as the amount of semiconductor was increased, the rate of photocatalytic degradation was also increased but after 0.10 g of photocatalyst, it becomes almost constant. This may be attributed to the fact that as the amount of semiconductor also increases, the exposed surface area of semiconductor was increased, but after a certain limit i.e. 0.10 g, if the amount of semiconductor was further increased, then there will be no increase in the exposed surface area of the photocatalyst. It may be considered like a
R. Ameta and D. I. Prajapati: Synthesis, Characterization and…. 2562 saturation point; above which, any increase in the amount of semiconductor had negligible or no effect on the rate of photocatalytic degradation of dye, as any increase in the amount of semiconductor after this saturation point would only increase the thickness of the layer at the bottom of the reaction vessel. This was confirmed by taking reaction vessels of different dimensions. The saturation point shifted to higher range for larger vessels, while reverse was true for smaller vessels. Effect of light intensity The effect of the variation of light intensity on the rate of photocatalytic degradation of Erythrosine B was also studied. For this, the distance between the light source and the exposed surface area was varied. The intensity of light at each distance was measured using Suryamapi (CEL Model SM201). The results are summarized in Table 5. Table 5: Effect of light intensity Light intensity (mWcm-2) k × 105 (sec -1) 20.0 1.96 30.0 2.69 40.0 3.33 50.0 3.84 60.0 4.91 70.0 5.41 80.0 5.97 pH = 8.0. [Erythrosine- B] = 3.0 × 10 -5 M. BaCrO4 = 0.10 g The results indicated that degradation of dye was accelerated as the intensity of light was increased from 20.0 to 80.0 mWcm-2, because any increase in the light intensity will increase the number of photons striking per unit area of semiconductor powder and as a consequence, a linear behavior between light intensity and rate of reaction was observed. Light intensity above the optimum value was not studied just to avoid thermal reaction. Mechanism On the basis of the experimental observations a tentative mechanism of photocatalytic degradation of Erythrosine B may be proposed as –
Int. J. Chem. Sci.: 14(4), 2016 2563 Erythrosine B (EB) molecules absorb radiation of suitable wavelength and excited to its first singlet state followed by intersystem crossing (ISC) to triplet state. On the other hand, the semiconducting barium chromate nanoparticles also utilizes the incident light energy to excite its electron from valence band to conducting band; thus, leaving behind a hole. This hole may abstract an electron from hydroxyl ions to generate hydroxyl radicals. These hydroxyl radicals will then oxidize the dye to its leuco form, which may ultimately degrade to less harmful products. hν ⎯→ ⎯ 1 1 EB EB ....(2) 0 1 ISC ⎯ ⎯ → ⎯ 1 3 ....(3) EB EB 1 1 hν + + ⎯ ⎯→ + - ....(4) SC e (CB) h (VB) or SC + − • + ⎯→ ⎯ ....(5) h OH OH • + ⎯→ ⎯ 3 OH EB Leuco EB ....(6) 1 Products ⎯→ ⎯ ....(7) Leuco EB The participation of •OH radicals as an active oxidizing species was confirmed by using hydroxyl radical scavengers (2-propanol), where the degradation rate was drastically reduced. Table 6: A comparative study for some physico-chemical parameters of aqueous solution of Erythrosine B (before and after treatment) Parameters Before treatment After treatment pH 6.41 6.96 Conductance (µS) 19.0 109.0 TDS (ppm) 9.0 62.0 DO (ppm) 5.7 9.1 COD (ppm) 20.3 4.0 BOD (ppm) 6.0 2.1 pH of the dye solution was 6.41 before treatment and it was found almost neutral after photocatalytic degradation of the dye. TDS and conductance were also increased from
R. Ameta and D. I. Prajapati: Synthesis, Characterization and…. 2564 9.0 to 62.0 ppm and 19.0 to 109.0 µS, respectively in treated water. Dissolved oxygen (DO) analysis measures the amount of gaseous oxygen dissolved in an aqueous solution and in the present case it was increased from 5.7 to 9.1 ppm. Enhancement in pH, conductivity, TDS and DO confirms the mineralization of dye to a significant extent. The value of chemical oxygen demand (COD) shows the oxidizability of a substance and it is expressed as the equivalent amount in oxygen of an oxidizing reagent consumed by the substance under fixed laboratory conditions. The chemical oxygen demand of reaction mixture before and after treatment has been determined by redox method. The photodegradation efficiency of the catalyst was calculated from the following expression: − COD COD = × before after η 100 …(8) COD before η = Photodegradation efficiency (%), CODbefore = COD of dye solution before illumination, and CODafter = COD of dye solution after illumination In the present case, COD was decreased from 20.3 to 4 ppm, which is a notable change. The photodegradation efficiency after 4 hours of illumination has been found to be 80.30%. Biological Oxygen Demand (BOD) is a measure of the oxygen used by microorganisms to decompose waste. BOD of the dye solution before and after treatment was decreased from 6.0 to 2.1 ppm, which shows that photocatalytic treatment increases the biodegradability. CONCLUSION Nano-sized barium chromate photocatalyst was prepared in the present investigation, which was characterized and used for photocatalytic degradation of Erythrosine B dye. The results revealed that the dye was completely degraded using this photocatalyst and the use of the catalyst can be explored further for degradation of different pollutants. ACKNOWLEDGEMENT The authors are thankful to PAHER University, Udaipur and M. G. Science Institute, Ahmedabad for providing necessary laboratory facilities. Thanks are also due toDepartment of Metallurgical and Materials Engineering, M. S. University, Baroda for analysis of synthesized barium chromate catalyst.
Int. J. Chem. Sci.: 14(4), 2016 2565 REFERENCES 1. R. Y. Hong, J. H. Li, L. L. Chen, D. Q. Liu, H. Z. Li, Y. Zheng and J. Ding, Powder Technol., 189, 426 (2009). 2. K. Byrappa, A. K. Subramani, S. Ananda, K. M. Lokanatha Rai, R. Dinesh and M. Yoshimura, Bull. Mater. Sci., 29, 433 (2006). 3. C. Ram, R. Pareek and V. Singh, Int. J. Theor. Appl. Sci., 4, 82 (2012). 4. R. Kumawat, I. Bhati and R. Ameta, Indian J. Chem. Technol., 19, 191 (2012). 5. C. S. Lim, M. L. Chen and W. C. Oh, Bull. Korean Chem. Soc., 32, 1657 (2011). 6. A. Vijay, S. Nihalani, I. Yadav and S. Bhardwaj, Res. J. Chem. Sci., 3, 60 (2013). 7. A. N. Rao, B. Sivasankar and V. Sadasivam, Indian J. Chem. A, 49A, 901 (2010). 8. C. Chen, J. Liu, P. Liu and B. Yu, Adv. Chem. Engineer. Sci., 1, 9 (2011). 9. A. Giwa, P. O. Nkeonye, K. A. Bello and K. A. Kolawole, J. Environ. Protect., 3, 1063 (2012). 10. H. Fu, J. Lin, L. Zhang and Y. Zhu, Appl. Catal, A, 306, 58 (2006). 11. F.S.–Ai, Z. J.–Hong and Z. Z.–Ping, New Carbon Materials, 23, 228 (2008). 12. I. Bhati, R. Ameta, P. B. Punjabi and S. C. Ameta, Int. J. Chem. Sci., 8, 2784 (2010). 13. S. Sharma, R. Ameta, R. K. Malkani and S. C. Ameta, Maced. J. Chem. Chem. Eng., 30, 229 (2011) 14. L. Zhang and Y. Zhu, Catal. Sci. Technol., 2, 694 (2012). 15. P. Sharma, R. Kumar, S. Chauhan, D. Sing and M. S. Chauhan, J. Nanosci. Nanotechnol., 14, 1 (2014). 16. T. Yan, L. Li, W. Tong, J. Zheng, Y. Wang and G. Li, J. Solid State Chem., 184, 357 (2011). 17. Y. Zhang, R. Selvaraj, M. Sillanpaa, Y. Kim and C. W. Tai, Chem. Eng. J., 245, 117 (2014). Accepted : 11.10.2016