Download
1 / 36
360 likes | 370 Views
PART FIVE: FIRM BEHAVIOR AND THE ORGANISATION OF INDUSTRY. The Costs of Production. Chapter 13. What did we learn so far?. Below is a summary of the first half of the semester Part One introduced us to economics

E N D
PART FIVE: FIRM BEHAVIOR AND THE ORGANISATION OF INDUSTRY The Costs of Production Chapter 13
What did we learn so far? • Below is a summary of the first half of the semester • Part One introduced us to economics • Ten principles (Ch.1); Thinking like an economist (Ch.2); Exchange and trade (Ch.3) • Part Two told us how markets work • Supply and Demand (Ch.4); Elasticities (Ch.5); Markets and government policies (Ch.6) • Part Three introduced welfare and efficiency • Consumer and Producer surplus(Ch.7); Costs of taxation (Ch.8); International trade (Ch.9) • Part Four looked at the public sector • Externalities (Ch.10); Public goods and common resources (Ch.11); Tax systems (Ch.12)
What do we learn in this book? • With Part Four, we finished our general introduction to the science of economics • Now we go into the details of microeconomics • Millions of producer firms, of all sizes and kinds, producing all types of goods or services constitute the backbone of a modern market economy • Some firms employ hundreds of thousands, operate globally and are household names everywhere • Others employ very few people and may not even be known locally • Yet, they must have many characteristics in common to coexist in the market place • It is time we take a close look at them
Plan of Part Five • Ch.13 analyses the cost structure of producers and defines all the cost elements upon which we build the remaining chapters • The cost structure established in Ch.13 will be used in the remaining chapters • Ch.14 establishes the determinants of supply in markets with a very high degree of competition • Ch. 15 looks at the extreme case of a single supplier in a market: monopoly • Ch. 16 deals with markets where a a small number of large firms dominate: oligopoly • Ch. 17 takes the case of fierce competition among large number of firms: monopolistic competition
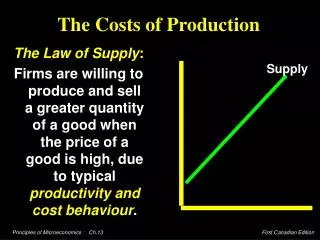
Law of supply and firm’s objective • Remember the Law of Supply • Firms are willing to produce and sell a greater quantity of a good or service when its price is higher and a smaller quantity when its price is lower • This results in a supply curve that slopes upward • The question becomes: why? • We start by establishing the objective of the firm • Firms exist to make as much money as possible for their owners • In other words, the economic goal of the firm is to maximise its profits • “Profit maximising firm” is a key concept for what follows
Revenue, cost and profit • To see how firms maximise profits, we must begin by defining the flows of income and expenditure of the firm that results in profits • Profits will be the difference between the revenues and the costs of the firm • Total Revenue is the amount that the firm receives for the sale of its product • Total cost is the amount that the firm pays to buy inputs for production • Profit is the amount a seller is paid minus its costs Profit = Total Revenue – Total Cost • For economic theory, profit is identical with the producer surplus of Ch.7
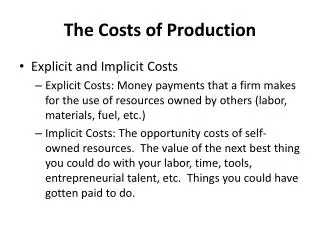
On measuring costs • The way economists handle costs differs from the way accounting or tax authorities do • Opportunity costs: • This is very important for economists even though it is not so relevant for accountants • A firm’s costs of production include all the opportunity costs of the inputs used during the production of its output of goods and services • Explicit and implicit costs: • Explicit costs involve a direct money outlay for factors of production • Implicit costs do not involve a direct money outlay but are nevertheless real costs for the firm
Profit: economic versus accounting • The defition of profits differ: • Economists include all opportunity costs when measuring costs • Accountants measure the explicit costs but as a ruleignore the implicit costs • The firm earn economic profits when total revenue exceeds both explicit and implicit costs • Economic profit is smaller thanaccounting profit • The opportunity cost of capital invested and labour spent has to be taken into account when we calculate economic profit • From this perspective a firm may have losses economically despite showing accounting profit
How an Economist How an Accountant Views a Firm Views a Firm Economic profit Accounting profit Implicit costs Revenue Total opportunity costs Explicit Explicit costs costs Economic profit versus accounting profit Revenue
Cost and production function • A firm’s costs reflect its production process • In order to understand the cost structure we must understand the relation between physical inputs such as equipment, raw materials and labour and the physical output obtained • For this purpose economists use the concept of the production function • Which shows the relationship between quantity of inputs used to make a good and the quantity of output of that good • We start with a fixed amount of machinery and equipment and see the impact on production of an increase in the amount of workers employed
Quantity of Output (cookies per hour) 150 Production function 140 130 120 110 100 90 80 70 60 50 40 30 20 10 0 1 2 3 4 5 Number of Workers Hired A production function
Marginal product • The production function constitutes the basis upon which the cost structure of the firm is built • Understanding by how much output rises in case of an additional input is very important • The marginal product of an input in production is the increase in the quantity of output obtained from an additional unit of that input • This is a key concept of the theory of the firm • It will be used again and again in the next chapters
Diminishing marginal product • In the production function example above, each new worker had a lower marginal product • Diminishing marginal product is the property whereby the marginal product of an input declines as the quantity of the input increases • Example: As more and more workers are hired at a firm, each additional worker contributes less and less to production because the firm has a limited amount of equipment • The slope of the production function measures the marginal product of an input, such as a worker • When the marginal product declines, the production function becomes flatter
Production function and total costs • Production function allows us to understand the cost structure of the firm • Because pricing decisions are determined by the relation between the quantity a firm can produce and how much it costs to produce that quantity • The total-cost curve shows this relationship graphically • Total-cost curve is a mirror image of the production function • After total-costs we will define marginal cost and different kinds of average costs • Almost all of the decisions by the producers are based on different costs of production
A production function and total cost Marginal Number of Output Cost of Cost of Total Cost Product of Workers (Quantity) Factory Workers of Inputs Labor 0 0 $30 $0 $30 1 50 50 30 10 40 2 90 40 30 20 50 3 120 30 30 30 60 4 140 20 30 40 70 5 150 10 30 50 80
Total-cost curve Total Cost $80 Total-cost curve 70 60 50 40 30 20 10 0 20 40 60 80 100 120 140 Quantity of Output (cookies per hour)
Various measures of cost • Costs of production of the firm can be divided into two basic categories: • Fixed costs • Variable costs • Total Fixed costs are those costs that do not vary with the quantity of output produced • Total Variable costs are those costs that do vary with the quantity of output produced. • Family of Costs: • Total Fixed Costs (TFC) • Total Variable Costs (TVC) • Total Costs (TC) TC = TFC + TVC
Average costs • Firms attach a big value to their average costs • Average costs can be determined by dividing the firm’s costs by the quantity of output produced • The average cost is the typical cost of each unit of product • Obviously, fixed, variable and total costs can also be expressed as averages, giving us the following family of average costs: • Average Fixed Costs (AFC) • Average Variable Costs (AVC) • Average Total Costs (ATC) ATC = AFC + AVC
Marginal cost • Economists attach a big value to marginal cost of production in firms • Marginal cost (MC) measures the increase in total cost that arises from an extra unit of production • In plain language, marginal cost helps answer the following question: • How much does it cost to produce anadditional unitof output?
Shape of the marginal cost curve • Now we must establish how cost curves behave on our graphs • We begin with the marginal cost curve • Marginal cost curve rises with the amount of output produced • Due to the effect of diminishing marginal product • At low levels of output, an increase in production will occur at a relatively small cost • Increasing output is more costly when theamount being produced is already high • Usually we show marginal cost as a curve that first declines then rises • But at times only as a rising curve
Quantity of Output (bagels per hour) Shape of the marginal cost curve Costs $3.00 2.75 2.50 2.25 MC 2.00 1.75 1.50 1.25 1.00 0.75 0.50 0.25 0 1 2 3 4 5 6 7 8 9 10 11 12 13 14
Shape of average cost curves • Average cost curves have different shapes • The average total-cost curve is U-shaped • In other words, at very low levels of output average totalcost is high because fixed cost is spread over only a few units • Average total-cost declines as outputincreases • Average total cost starts rising becauseaverage variable cost rises substantially • Average fixed cost curve is always downward • As its name implies, larger quantities of output means smaller fixed costs per unit produced • Average variable cost curve reflects the marginal cost curve and behaves like it
Quantity of Output (bagels per hour) Shape of average cost curves Costs $3.00 2.75 2.50 2.25 2.00 1.75 1.50 ATC 1.25 AVC 1.00 0.75 0.50 0.25 AFC 0 1 2 3 4 5 6 7 8 9 10 11 12 13 14
Relationship between marginal cost and average total-cost • There exists a very peculiar and important relation between marginal and average total-cost curves • Whenever marginal cost is less than average total- cost, average total-cost is falling • Whenever marginal cost is greater than average total-cost, average total-cost is rising • The marginalcost curve intersects with the averagetotal-cost curve at the efficient scale • Efficient scale is the quantity thatminimizes average total-cost • In other words MC curve crosses the ATC curve at the minimun point of the latter
Quantity of Output (bagels per hour) Relationship between marginal cost and average total cost Costs $3.00 2.75 2.50 2.25 MC 2.00 1.75 1.50 ATC 1.25 1.00 0.75 0.50 0.25 0 1 2 3 4 5 6 7 8 9 10 11 12 13 14
Costs in the long run • The cost structure we studied until now is based on the characteristics of the production function • Where we allowed changes in one input while the other inputs (i.e. stock of capital) were constant • In the long run all inputs become variables • For many firms, the division of total costs between fixed and variable costs depends on the time horizon being considered • In the short run some costs are fixed • In the long run fixed costs becomevariable costs • Because many costs are fixed in the short run but variable in the long run, a firm’s long-run cost curves differ from its short-run cost curves
Scale and long-run costs • Once we allow the stock of capital such as machinery and equipment to be variable new issues appear • An increase in the size or scale of the firm may have vaıious effects on its cost • Economies of scale occur when long-run average total-cost falls as the quantity of output increases • Diseconomies of scale occur when long-run average total-cost rises as the quantity of output increases • Constant returns to scale occur when long-run average total-cost stays the same as the quantity of output increases
Long-run average-total costs Average Total ATC in short run with medium factory ATC in short run with large factory ATC in short run with small factory Cost 0 Quantity of Cars per Day
U-shaped long-run average total cost Average Total Cost ATC in long run Constant returns to scale Economies of scale Diseconomies of scale 0 Quantity of Cars per Day
Conclusion • The goal of firms is to maximize profit, which equals total revenue minus total cost • Economists calculate opportunity costs of all inputs even there is no apparent payment for some of them • Accounting practise covers only explicit cost but not implicit opportunity costs • Economic profit is usually smaller than accounting profit • The production function establishes the basis upon which costs are calculated • It shows the relation between the quantities of inputs and the quantity of output • Diminishing marginal product is assumed
Conclusion • A firm has fixed and variable costs: fixed costs don’t vary with quantities produced and variable costs do • Average total-cost is total-cost divided by the quantity of output • Marginal cost is the amount by which total cost rises if output is increased by one unit • Shapes of the cost curves are very important for economic analysis • Marginal cost generally rises with the quantity of output • Average total-cost first falls as output increases and then eventually rises with further output
Conclusion • Average fixed cost falls as output increases • Average variable cost is closely related to the marginal cost and behaves similar to it • A firm’s costs often depend on the time horizon being considered • Many costs are fixed in the short run but variable in the long run • Long-run changes in the size and scale of the firm have an impact on its cost structure • When the level of production changes, average total- cost may rise more in the short run than in the long run