Download
1 / 55
600 likes | 895 Views
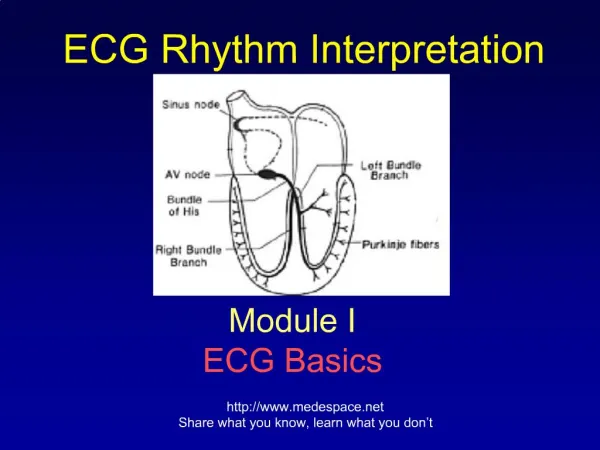
Advanced ECG Interpretation. Dr. Jeffrey Elliot Field, HBSc. DDS, Fellow, American Dental Society of Anesthesia Diploma, the National Dental Board of Anesthesia. 1. 6/10/2014. OBJECTIVES. To get a more in depth knowledge of ECG interpretation. The P-Wave in Detail. The normal P-wave:

E N D
Advanced ECG Interpretation Dr. Jeffrey Elliot Field, HBSc. DDS, Fellow, American Dental Society of Anesthesia Diploma, the National Dental Board of Anesthesia. • 1 6/10/2014
OBJECTIVES • To get a more in depth knowledge of ECG interpretation.
The P-Wave in Detail • The normal P-wave: • Has a smooth contour • Is monophasic in lead II • Is biphasic in lead V1 • Has a duration 0f less than 0.12 seconds or 3 small boxes.
P-wave Abnormalities Seen in Lead II • In lead II two types of P-wave abnormalities can be seen. • Right atrial enlargement is seen as a taller than normal P-wave( increased amplitude) • Left atrial enlargement seen as a P-wave with a notch in it.
P-Wave Abnormalities Seen In V1 • Biphasic P-Waves are seen for both left and right atrial enlargement. • For right atrial enlargement the initial portion of the P-wave is larger than the distal portion. • Alternatively for left atrial enlargement the initial portion of the P-wave is smaller than the distal portion.
P Pulmonale ( right atrial enlargement) Note the larger initial portion
P Mitrale ( left atrial enlargement) Note the larger terminal portion
The QRS Complex in Detail • As well as showing ventricular conduction defects, the QRS complex along with ST segment analysis is used to diagnose myocardial oxygen deficits and myocardial infarctions. • The QRS complex is also used to diagnose accessory conduction pathways in the heart.
S-T Segment Analysis • In order to assess the S-T segment we must first define the J-point. • The J point in the ECG is the point where the QRS complex joins the ST segment. It represents the approximate end of depolarization and the beginning of repolarization.
The Isoelectric Point • S-T segments can be elevated, depressed or isoelectric. • The J-point is deemed to be isoelectric if the S-T line/segment is not elevated or depressed with respect to the P-Q line/segment. As in the diagram below. See arrows
S-T Changes • You can see both S-T elevation and S-T depression on ECG’s. • S-T elevation is indicative of a myocardial infarction. So in other words myocardial cell death is occuring. • S-T depression is indicative of myocardial ischemia. The myocardial cells are not getting enough oxygen and are at risk of dying.
Myocardial Infarction • Myocardial infarctions can be categorized as follows: • -Q-wave MI • -Non Q-wave MI
Q-Wave Myocardial Infarction • This is the classic presentation for MI’s. • The developing MI is seen as ST segment elevation followed by deepening Q-waves in the leads where ST segment elevation was 1st seen. • Q waves are “significant” if they are greater than 1 box in width (longer than 0.04 msec), or are larger than 1/4 of the R wave. • Significant Q waves are indicative of myocardial infarction. • However signifigant Q-waves in lead III alone are NOT diagnostic of an infarction, even they are otherwise “significant” in size and width. • Therefore signifigant Q-waves in lead III are ignored unless other abnormalities are seen.
Non Q-Wave Myocardial Infarction • In this case you get classic signs and symptoms of an MI(i.e elevated cardiac enzymes and markers and of course physical signs of an MI ( chest pain ,nausea ,vomiting , etc) But non of the usual ECG changes ( i.e. ST segment elevation and deepening Q-waves). In fact sometimes the only clue on the ECG are inverted T-waves.
Accessory Conduction Pathways. Also Called Pre-Excitation Syndromes
Pre-excitation Syndromes • These syndromes are characterized by an aberrant conduction pathway that enters the ventricular muscle in addition to the normal pathway. Since these aberrant pathways are shorter they cause ventricular depolarization prior to the normal pathway. • There are 2 pre-excitation syndromes • Wolf –Parkinson-White • Lown-Ganong-Levine Both pathways show shortened P-R intervals of less than 0.20 sec.
Wolf Parkinson White • The abberant pathway is the bundle of Kent which bypasses the AV node. This gives a shortened P-R interval ( i.e. less than 0.20 seconds) • There is a shoulder on the R-wave of the QRS complex. This shouldered QRS complex is called a Delta-wave and is the result of a fused ( fusion) beat from the normal and aberant pathway.
Wolf Parkinson White Delta Wave
Lown-Ganong-Levine • The aberant pathway is the bundle of James which joins the normal pathway above the AV node. • Since the abnormal pathway joins the normal pathway Above the AV node rather than within it there is no delta wave but just a shortened PR interval (i.e. less than 0.20seconds)
Importance of Pre-Excitation Syndromes These can lead to severe tachycardia's.
Bundle Branch Blocks In bundle branch blocks either the right or the left branch is partially ( hemiblocks) or totally blocked. If both right and left bundle branches are blocked, this is termed complete or third degree heart block. Normally both bundle branches depolarize simultaneously but with bundle branch blocks the unblocked side depolarizes first and its impulse then spread to the blocked ventricle . So depolarization of the ventricles is sequential. The major significance of a new BBB is that it may indicate the presence of a previously unknown underlying cardiovascular disease.
Right Bundle Branch Blocks Conditions that cause this are : -pulmonary embolism -chronic lung disease -cardiomyopathy -atrial and ventricular septal defects -However in some individuals RBBB is seen in perfectly healthy individuals and is a variant of normal.
Right Bundle Branch Block • Right Bundle branch block is seen as 2 R-waves R and R prime with an intervening S-wave in leads V1,V6 and lead 1. The s wave is deep in lead 1 and V1 . This is called R, S, R-prime.
Left Bundle Branch Block In Contrast to RBBB LBBB is almost always indicative of underlying cardiac pathology. There is no normal variant. Conditions that cause this are : -dilated cardiomyopathy -hypertrophic cardiomyopathy -hypertension -aortic valve disease -coronary artery disease
Left Bundle Branch Block • Left Bundle branch blocks are seen in Leads 1 , V1 and V6 as 2 R-waves. R and R prime without an intervening S-wave. The wave between the R-waves is scooped. R-Rprime
Clinical Considerations for Bundle Branch blocks • All patients with a bundle branch block should be cleared by their physician prior to any in office anesthesia. • Fortunately it is uncommon for a stable right or left bundle branch block to develop into complete heart block. Therefore with physician approval in office anesthesia can be safely performed
Q-T Segment Abnormalities • Q-T segment analysis is very complicated and complete dissertation is out of the scope of this presentation. • That being said the Q-T interval is based on or corrected for the heart rate. The equation is: • QT corrected=QT/the square root of the R-R interval in seconds.
Normal Q-T • The normal Q-T corrected interval is different in males and females. • < 0.430 seconds in males and < 0.450 seconds in females.
QT Interval Abnormalities • Digoxin toxicity causes a shortened QT interval with a scooping of the ST segment. Note the Q-T segment is only 8 small boxes wide 0.32 seconds divided by the square root of 1.16 ( 29 X 0.04)( the number of small boxes X 0.04 seconds)= 1.07. So Q-T corrected is 0.32/1.07=0.30 seconds
Although digoxin treatment toxicity is outside the scope of this lecture suffice it to say that under and over digitalization can lead to severe arrhythmia's and cardiac depression. • So if your patient is on digoxin you have to know their digoxin levels and get physician approval to proceed with in office ansthesia.As such these patients may be inappropriate for in office anesthesia.
Other Causes of Short Q-T Intervals • 1) familial/genetic short Q-T syndrome • 2) Hypercalcemia • 3) Hyperthermia
Causes of Prolonged Q-T Intervals • 1) familial/genetic prolonged Q-T syndrome • 2) Hypocalcemia
Although calcium abnormalities are also outside the scope of this lecture suffice it to say that they can lead to severe arythmia’s and cardiac depression.
Potassium Induced ECG Changes Including T-Wave Abnormalities • Hyperkalemia as it evolves leads to tall peaked T-waves, prolonged P-R interval and a widened QRS complex. Eventually the P-wave is lost and the QRS becomes biphasic • Hypokalemia leads to small biphasic flattened T-waves, S-T depression and a prominent U-waves .The U-wave is an extra wave after the T-wave.
Abnormalities in Serum Potassium • Potassium abnormalities are worth dwelling on for a moment as we are likely to encounter them in our day to day practice. • Either hypo or hyperkalaemia can lead to severe cardiac events and both need urgent treatment. • Normal serum potassium is 3.0-5.0 milliequivalents per litre of blood.
The red flags to look for are: • patients on diueretics who loose potassium. • Patients on exogenous potassium tablets who can get hyperkalemia. • In either of these groups it is worth getting preop electrolytes done.
ECG diagnosis does not have to be difficult as long as you take an orderly and well thought out approach.
PUTTING IT ALL TOGETHER • 1) Look at the rhythm. Is it regular or irregular. • 2) Determine the rate. Is it normal, fast or slow. • 3) Determine the relationship ( if any) between the P-wave and the QRS complexes. • 4) Look at the intervals , PR, QRS, QT.
PUTTING IT ALL TOGETHER • 5) Finally look at recognizable patterns to sort out a difficult diagnosis: • sawtooth P-waves in atrial flutter. • a missing QRS complexes in PAC’s. • irregularly irregular rhythm for atrial fibrillation. • delta waves for WPW. • RSR prime for RBBB. • RR prime with loss of S in LBBB. • Deep Q waves in MI , large T waves in hyperkalemia etc. • Missing P-waves in junctional rhythms.
Categorizing Rhythms With Respect To An Interventional Hierarchy . Know when to worry!