Download
1 / 13
130 likes | 290 Views
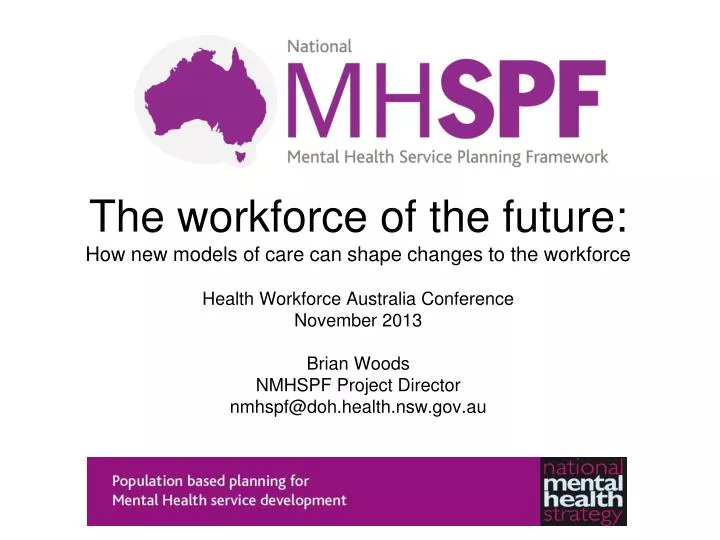
The workforce of the future: How new models of care can shape changes to the workforce Health Workforce Australia Conference November 2013 Brian Woods NMHSPF Project Director nmhspf@doh.health.nsw.gov.au. Model - Top to Bottom. Population & Epidemiology. Demand. Service Mapping.

E N D
The workforce of the future: How new models of care can shape changes to the workforceHealth Workforce Australia ConferenceNovember 2013Brian WoodsNMHSPF Project Directornmhspf@doh.health.nsw.gov.au
Model - Top to Bottom Population & Epidemiology Demand Service Mapping Clinical Care Rate Care Packages Resource Predictions Output Predictions Staff Predictions & Costs
Model - Left to Right Population & Epidemiology Prevention Clinical/Non Clinical Care Concept of Universal Promotion & Prevention Concept of Indicated Prevention Concept of a mild illness Concept of a moderate illness Concept of a severe illness
Key messages • Nationally consistent- an ‘Australian Average’ estimate of need, demand and resources • Flexible and Portable- to suit jurisdictional priorities and other variations in a user friendly format • Not all, but many- will not account for every circumstance or service possibly required • Not who, but what- will capture the types of care required, but will not define who is to deliver • Evidence & Expertise- identify what services ‘should be’ provided underpinned by evidence
Taxonomy structure Service Group Service Stream Service Category Service Element Service Activity Service Quantification
MH Promotion MH Prevention Population Based, Universal Services Services tailored to individual needs Primary and Specialised Clinical Ambulatory MH Care Services Specialised MH Community Support Services Specialised Bed-Based MH Care Services Mental Health Services Non Mental Health Services
Service Group Service Stream Service Category Service Element Service Activity Population & Epidemiology All IP Mild Moderate Severe CP1 IPCP1 MiCP1 MiCP2 MoCP1 MoCP2 SCP1 SCP2 Population Based, Universal Services Primary MH Care Services Specialised Clinical MH Care Services Specialised MH Community Support Services (∑) Resource Predictions
65+ BPSD 12 to 17 18 to 64 5 to 11 0 to 4 65+