Download
1 / 29
290 likes | 376 Views
PERFORMANCE OF FOODGRAIN PRODUCTION DURING 2010-11. Department of Agriculture Andhra Pradesh. Andhra Pradesh The Most Happening State in Agriculture Sector. STRUCTURE. 1. Results of Crop Cutting Experiments - SASA. II. Procurement Figures of Foodgrains 2010-11.

E N D
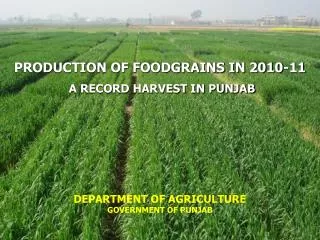
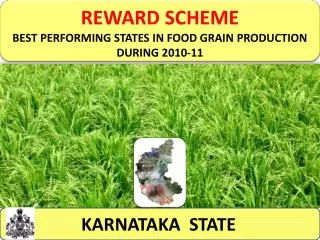
PERFORMANCE OF FOODGRAIN PRODUCTION DURING 2010-11 Department of Agriculture Andhra Pradesh
Andhra Pradesh The Most Happening State in Agriculture Sector
STRUCTURE 1. Results of Crop Cutting Experiments - SASA II. Procurement Figures of Foodgrains 2010-11 III. Expenditure under State / Central Programmes 2007-08 to 2010-11 IV. New Innovations / Initiatives Adopted by A.P V. Inter Departmental Coordination VI. Future Prospects for Foodgrains Production
I. RESULTS OF CROP CUTTING EXPERIMENTS-SASA • DES is designated as SASA (State Agricultural Statistics Authority) in AP • Crop cutting experiments are planned for 21 Principal crops every year (Kharif + Rabi) for estimating crop wise season wise production • 18964 crop cutting experiments planned during (2009-10) & 18660 experiments were analysed with a response of 98.4%.
RESULTS OF CROP CUTTING EXPERIMENTS-SASA Crop wise productivity for the year 2008-09 to 2010-11 are given below: Source: Dept. of Directorate of Economics & Statistics
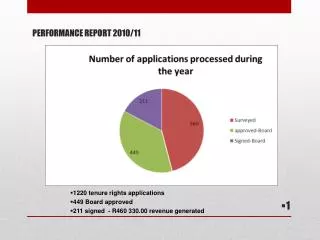
II. Procurement figures of Foodgrains for 2010-11 Statement showing procurement of Rice (in Lakh tonnes) * Severe drought year Source: Agriculture Statistics at a glance- Ministry of Agriculture GOI Procurement of Rice for 2010-11(AS on 06-6-2011) 1230 procurement centers are opened. Procurement as on 06.06.11 – 59.18 lakh tons of Rice(last year 53.00 lakh tones as on date) Expected Procurement - about 100.00 lakh tons by end of September-11 Source: Dept. of Civil Supplies
Food Grains production - All India Vs Andhra Pradesh. (Million Tons) • * DES III estimates – Departmental Estimate is about 207.56 lakh tons • Andhra Pradesh has only 5.49% of the area under foodgrains in India
III. Expenditure under State as well as Central Programmes from 2007-08 to 2010-11 supporting to Foodgrain production Releases & expenditure particulars from 2007-08 to2010-11 (Rs in lakhs)
Anlysis of increase in Allocation & Efficency Impact of National Food Security Mission RICE Area Production Yield
IMPACT OF RKVY • Seed Production chain was strengthened by increasing production of Breeder, foundation and certified seed (Qty in Qtls)
Thrust was given to supply of high cost machinery such as Combine harvesters, Paddy transplanter, power weeders etc., to the Farmers groups/ RMGs and other improved farm implements to the individual farmers to overcome the present day farming threats i.e., labour scarcity and high labour cost. The farm power utility has been increased from 2.00 Kw /ha in 2006 to 3.4 KW/ha in 2010 Yield increase up to 10-20% Savings in inputs by 20% • IMPACT OF RKVY Combine harvester Paddy transplanter
IMPACT OF ATMA • As per the 3rd Party Monitoring and Evaluation reports (June – 2008) • Changes occurred in cropping patterns • (Paddy- Paddy changed in to Paddy- maize in Chittoor district, • Cotton- pulses in to Soybean- cotton- sunflower in Adilabad, • Paddy- Jowar in to Paddy – Sun flower in Srikakulam etc. ) • New crops were introduced through ATMA in districts (Soybean, Sweet corn and grapes in Adilabad, Sunflower in Krishna, Maize in Nizamabad and Chittoor) • After attending ATMA activities, 32 % of farmers are having high level of adoption to new technologies like zero tillage in Maize, SRI Cultivation, organic vegetable growing and 56% of farmers are having medium level of adoption where as before ATMA inception the level of adoption of new technologies is low in 86%of farmers. • Due to transfer of new technologies through ATMA, the beneficiaries got increase in yield from 10 to 30% in different crops, The yield increase 10 to 15% in Groundnut, 20to 30% in Maize, 15 to 25 % in Paddy, 12- 15 % in Vegetables and 20 to 25 % in Fodder.
IV. New Innovations / Initiatives – Andhra Pradesh • a) Promotion of SRI • Active campaign by extension staff in all the districts for promoting SRI cultivation except in command areas and problematic soils • Intensive training to extension staff, farmers and Labour. • Establishment of Steering Committee at State Level
ANGRAU, NABARD, DRR, ICRISAT and NGOs involved • Each district is having a SRI coordinator • Compendium of instructions on SRI issued • Supervisory teams from headquarter deputed to districts • SRI secretariat established at head quarter for close monitoring • Documentation of Success stories • An are of 91000 ha covered – 2010-11. • Target for 2011-12 is 3.50 lakh ha.
b) Increasing area under pulses • The Normal area under pulses is 19.16 lakh ha. • Targets were allotted for increasing intercrop area under Groundnut, Jowar, Maize and Cotton etc. • Weekly reviews were conducted at Govt. level. • During 2010-11 the area increased by 1.59 lakh ha. • Intercrop area increased by 1.31 lakh ha • Pure crop area increased by 0.28 lakh ha • The plan for 2011-12 is to increase the area to 23.00 lakh ha.
Targets and Achievements under Total Pulses From 2007-08 to 2009-10 and targets for 2011-12 NDC base level :- 12.50 lakh tons Target for 2011-12:- 16.00 lakh tons * Third Estimates Achievement Source:- DES
c) Organization of Soil Testing Awareness Campaign • It is planned to collect @15 no. of soil samples per village (26,613 No. of Revenue villages) • The Samples collected till date is 3.27 lakhs. • Soil health cards are issued to all farmers • From 2008-09 , 10.00 lakh cards are up loaded • Efforts are on to send the results through SMS.
Farming Situationbased Soil sample collection 2011-12 • 240 farming situations delineated in 9 Agro Climatic Zones. • It is proposed to collect 15 samples per farming situation totaling to 3355 samples • Analyze N.P.K and Micronutrients. • Coordination with ANGRAU & ICRISAT
V. Inter Departmental coordination a) RythuChaitanyaYatras • The Department is conducting RythuChaitanyaYatra ( RCY) as a group approach of Technology Transfer to Farmers with integrated team represented by Agriculture, AH, Fisheries, Horticulture, Sericulture, Forestry, Agril University, Financial Institutions, irrigation, Electricity Dept. visit each village, hamlet during RCY (17.05.11 to 02.06.11) • 20.08 lakh farmers participated
b) Credit • Under Credit Incentive Scheme an amount of Rs. 5000/- per farmer was paid who have totally repaid the loan and could not benefit from debt waiver scheme. (31.88 lakh farmers – Rs. 1632.94 crores). • Loan Eligibility Cards issued to tenant farmers – Govt. Memo. No. 14369, Dt: 18.11.10 of revenue department. • 7.79 lakh new non loanee farmers extended credit of 936.73 crores during 2010-11. • 2.67 lakhs tenant farmers enrolled and 0.95 lakh tenant farmers extended credit of Rs. 190.08 crores. • 58500 JLGs of tenant farmers formed • Model farmers deployed for facilitating bank loans and recovery. • A Target for enrolment of new non loanee farmers @ 330 farmers per branch is fixed during 2011-12. (Rs. In crores)
c) Power • Free power to 26.53 lakh agricultural consumers in the state for betterment of the farming community. • Assured minimum seven hours of power supply to agriculture. • Government has announced to provide free power supply also to Tatkal Agricultural consumers. • 1.40 lakh new consumers provided free power during 2010-11. • Agricultural services are released to consumers on priority.
d) Irrigation • Convergence for analyzing soil samples from command areas and promoting soil testing based (balanced) fertilizer use through water user Associations (WUAs) • 165 FFS were conducted by KVKs under projects for enhancing crop and water productivity. • Facilitated supply of Agril. machinery for WUAs. • During 2009-10 in Godavari delta due to limited water supply the Water User Associations (WUAs) were motivated for adoption of rotational irrigation and thereby irrigate the entire contemplated ayacut by achieving WUE of 5000 ha /TMC. • During Kharif 2010 in Nizamsagar due to adoption of conjunctive use of ground water with just 2.5 TMC, 32000 ha of paddy area was irrigated and harvest one month in advance by planting early.
e) Fertilizers • Senior railway officer from Railways has been appointed by the state Govt. to liaison with the Department in allocation of rakes for speedy movement of fertilizers from manufacturing units/ports • Buffer stocks of DAP, Complex and Urea @ 1.00LMT are maintained with APMARKFED for releasing the stocks to the needy areas incase of exigency. • Regular persuasion with all the manufacturers/suppliers for ensuring supplying of stocks to the needy areas in time . • Taking up issues of supply, distribution and availability of fertilizers with the Department of Fertilizers, GoI on daily basis and also in the weekly Video Conferences. • Coordination with Revenue, vigilance & enforcement Department in Checking cross border movement of fertilizers to other states.
VI. Future Prospects for Foodgrains Production in lakh MTs * As per III Advanced Estimates. Departmental estimates indicate a production of about 208.00 lakh tons.
Expenditure under State as well as Central Programmes from 2007-08 to 2010-11 supporting to Foodgrain production Releases & expenditure particulars from 2007-08 to2010-11 (Rs in lakhs) Foodgrain production particulars from 2006-07 to 2010-11 (Lakh Mts) • * DES III Advanced Estimates • Dept. Estimates is 207.56 lakh MTs during 2010-11
IMPACT OF RKVY • Quality seed of improved variety was distributed to the farmers resulting in increase in SRR . • Seed Production chain was strengthened by increasing production of Breeder, foundation and certified seed