1 / 1

Supp. Figure -3

Supp. Figure -3. Control Diabetic. Blue circle indicates Glycated HSA as a positive control, whose intensity is uniform in both the blots.

twila
Download Presentation

Supp. Figure -3

An Image/Link below is provided (as is) to download presentation Download Policy: Content on the Website is provided to you AS IS for your information and personal use and may not be sold / licensed / shared on other websites without getting consent from its author. Content is provided to you AS IS for your information and personal use only. Download presentation by click this link. While downloading, if for some reason you are not able to download a presentation, the publisher may have deleted the file from their server. During download, if you can't get a presentation, the file might be deleted by the publisher.

E N D

Presentation Transcript


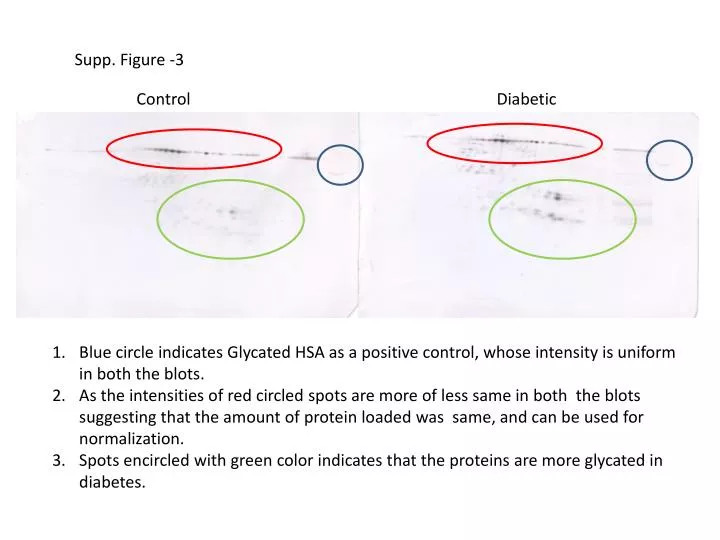
  1. Supp. Figure -3 Control Diabetic Blue circle indicates Glycated HSA as a positive control, whose intensity is uniform in both the blots. As the intensities of red circled spots are more of less same in both the blots suggesting that the amount of protein loaded was same, and can be used for normalization. Spots encircled with green color indicates that the proteins are more glycated in diabetes.

More Related