Download
1 / 33
340 likes | 501 Views
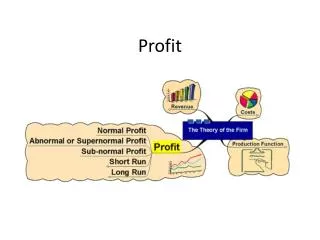
PROFIT FORMULA. Profit Formula Profit = Sales – Variable Cost – Fixed Cost P=S – V – F P=S – (V+F)=(S-V)-F Where P = Total Profit, S=Sales value V= Total variable cost, F= Total Fixed Cost. BREAK-EVEN ANALYSIS.

E N D
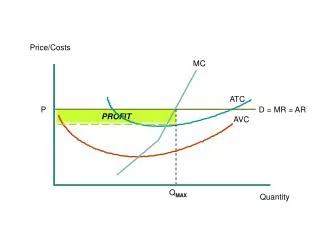
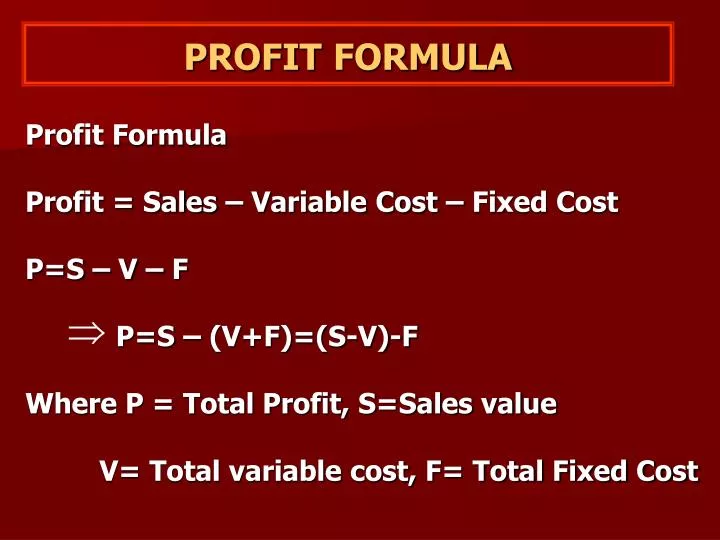
PROFITFORMULA Profit Formula Profit = Sales – Variable Cost – Fixed Cost P=S – V – F P=S – (V+F)=(S-V)-F Where P = Total Profit, S=Sales value V= Total variable cost, F= Total Fixed Cost
BREAK-EVEN ANALYSIS It is an application of CVP analysis which involves the method of presenting to management the effect of changes in volumes on profits by indicating at what level the total cost and total revenue will be in equilibrium, i.e., by indicating the Break-even Point. Break-even analysis is a technique of having a preview of profit prospects and a tool of profit-planning by integrating the cost and revenue estimates to ascertain the profits and losses associated with different levels of output.
BREAK-EVEN CHART It is a graphical representation from which Break-even Point (BEP) and related categories are determined graphically. The BE Chart depicts at various levels, the following information: i) Variable costs, fixed costs and total cost. ii) Break-even point. iii) Margin of Safety. iv) Sales value.
BREAK-EVEN-POINT It is that volume of production and sales where there is no profit or loss, i.e., where Total Revenue and Total Cost lines intersect. Total Sales Opening Profit Total Cost MOS (Rs.) Angle of incidence Operating Loss Total Variable Cost Cost and revenue(Rs) BEP Total Fixed Cost BEP (Units) BEP (Rs.) MOS (Units) O Output (Units)
1) CONTRIBUTION: It is the excess of sales revenue over and above the total variable costs.Contribution=Sales – Variable CostsAgain since Profit=(Sales – Variable Cost) – Fixed Cost Profit = Contribution – Fixed cost Contribution = Fixed Cost + Profit.
2) PROFIT-VOLUME RATIO:It represents the ratio of contribution to sales and called as p/v ratio . It has property fundamental that p/v ratio remains constant at various levels of activity provided there is no change in either selling price (per unit) or variable cost (per unit).
PROFIT AS BUSINESS OBJECTIVE Accounting Profit vs. Economic Profit Accounting profit = TR – (W + R + I + M) Where W = wages and salaries, R= rent, I = interest, and M = cost of materials.
CONTROVERSY OVER PROFIT MAXIMIZATION OBJECTIVE: THEORY VS PRACTICE Arguments in Defence of Profit Maximization Hypothesis Profit is indispensable for firm’s survival.
BAUMOL’S HYPOTHESIS OF SALES REVENUE MAXIMIZATION Baumol has postulated maximization of sale revenue as an alternative to profit- maximization objective.
WILLIAMSON’S HYPOTHESIS OF MAXIMIZATION OF MANAGERIAL UTILITY FUNCTION
DEFINITION OF NATIONAL INCOME Conceptually, national income is the money value of the end result of all economic activities of the nation.
GROSS NATIONAL PRODUCT (GNP) The GNP is defined as the value of all final goods and services produced during a specific period, usually one year, plus incomes earned abroad by the nationals minus incomes earned locally by the foreigners.
GROSS DOMESTIC PRODUCT (GDP) The Gross Domestic Product (GDP) is defined as the market value of all final gods and services produced in the domestic economy during a period of one year, plus income earned locally by the foreigners minus incomes earned abroad by the nationals.
NET NATIONAL PRODUCT (NNP) NNP is defined as GNP less depreciation, i.e., NNP = GNP – Depreciation
METHODS OF MEASURING NATIONAL INCOME • Net Output or Value Added Method • Factor-Income Method • Expenditure Method
(C) ( Y) C / Y MARGINAL PROPENSITY TO CONSUME (MPC) The concept of MPC is related to the marginal consumption-income relationship. In other words, MPC refers to the relationship between change in consumption and the change in income The MPC is symbolically expressed as
( Y) ( I) THE DYNAMICS OF INVESTMENT MULTIPLIER The dynamics of multiplier tells how a Multiplies into . Investment means expenditure on factors of production – capital and labour .
DETERMINANTS OF ECONOMIC GROWTH There are four important determinants of economic growth, viz., • Human resources and its quality, • Natural resources, • Capital formation, and 4. Technological development
HARROD-DOMAR THEORY OF GROWTH Both Harrod and Domar consider capital accumulation as a key factor in the process of economic growth.
THE NEO-CLASSICAL MODEL According to the neo-classical model, rate of economic growth depends on the growth rate of (i) capital stock, K; (ii) labour supply, L; and (iii) technological progress over time, T. The relationship between the national output and these variables may be expressed in the form of a production function, i.e., Y=F(K, L, T) Where Y= national output (at constant price), K=stock of capital L = labour supply, and T= the scale of technological progress.
PHASES OF BUSINESS CYCLES 1. Expansion of economic activities, 2. Peak of boom or prosperity, 3. Recession, the downtrend, 4. Trough, the bottom of depression, and 5. Recovery and expansion. Steady Growth line Expansion Peak Prosperity Recession Expansion Prosperity Depression Recovery Line of cycle Trough
THEORIES OF BUSINESS CTCLE 1. The Pure Monetary Theory, 2. The Monetary Overinvestment Theory , 3. The Non- monetary Overinvestment Theory , 4. Innovation Theory, 5. Acceleration Principle of Trade Cycle,
CONCEPT AND OBJECTIVES OF STABALIZATION Stabalization does not mean creating condition for economic stagnation. Stabalization and stagnation or freezing should not be treated as synonymous. Stabalization broadly means preventing the extremes of ups and down.
FISCAL POLICY The ‘fiscal policy’ refers to the government policy of changing its taxation and public expenditure programmes intended to achieve certain predetermined objectives.
MONETARY POLICY Monetary policy refers to the central bank’s programme of changing monetary variables. (i) Open market operations, (ii) changes in bank rate (or discount rate), and (iii) changes in the statutory reserve ratios.
BASIS OF FOREIGN TRADE The basis of international trade is the difference in the resource endowments of the nations.
RICARDIAN THEORY OF COMPARATIVE ADVANTAGE The theory of absolute advantage gives the impression that trade between two countries can be possible and mutually gainful only if both the countries have absolute advantage in the production of at least one commodity and absolute disadvantage in the production of at least one commodity.
TERMS OF TRADE Terms of trade is defined as the quantity of domestic goods that must be given in exchange for one unit of imported goods.
FREE TRADE POLICY Free trade policy is based on the principle of non-interference by the government in the foreign trade.
THE BALANCE OF PAYMENTS DefinitionThe balance of payment is defined as “ a systematic record of all economic transactions between the residents of a country and residents of foreign countries” during a certain period of time.
BALANCE OF PAYMENTS ACCOUNTS (i)Current accounts and (ii)Capital accounts.
INDIRECT MEASURES TO CORRECT ADVERSE BOP (i) Income measures, and (ii) Price measures. DIRECT MEASURE: EXCHANGE CONTROL