Download
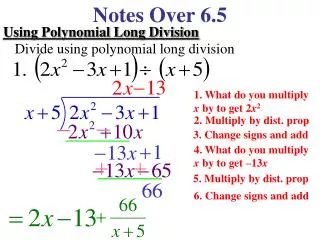
1 / 7
70 likes | 170 Views
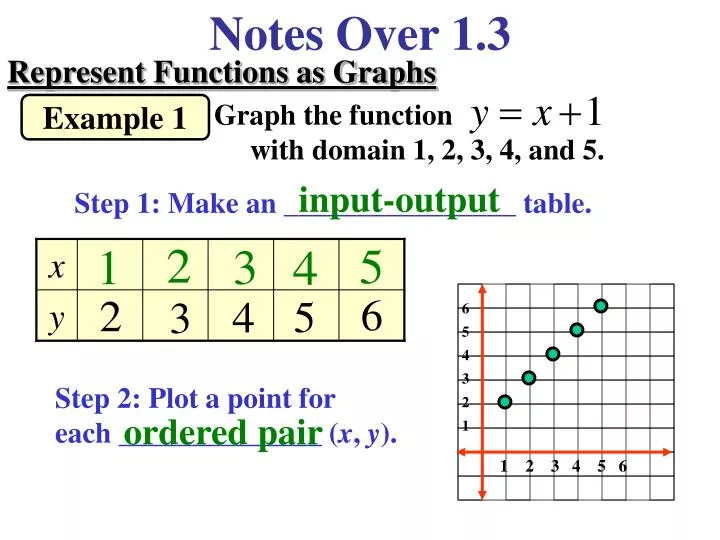
Notes Over 1.3. Represent Functions as Graphs. Graph the function with domain 1, 2, 3, 4, and 5. Example 1. input-output. Step 1: Make an ________________ table. 6 5 4 3 2 1.

E N D
Notes Over 1.3 Represent Functions as Graphs Graph the function with domain 1, 2, 3, 4, and 5. Example 1 input-output Step 1: Make an ________________ table. 6 5 4 3 2 1 Step 2: Plot a point for each ______________ (x, y). ordered pair 1 2 3 4 5 6
Notes Over 1.3 Represent Functions as Graphs • Graph the function with domain 0, 3, 6, 9, and 12. 6 5 4 3 2 1 2 4 6 8 10 12
Notes Over 1.3 Represent Functions as Graphs Example 2 6 5 4 3 2 1 Write a rule for the function represented by the graph. Identify the domain and the range of the function 2 4 6 8 10 12 table Step 1: Make a _________ for the graph. relationship Step 2: Find a _____________ between the input and output. Each output is 1 less than half the input
Notes Over 1.3 Represent Functions as Graphs Example 2 6 5 4 3 2 1 Write a rule for the function represented by the graph. Identify the domain and the range of the function 2 4 6 8 10 12 function rule Step 3: Write a _______________ that describes the relationship: 2, 4, 6, 8, and 10 The domain of the function is _______________. 0, 1, 2, 3, and 4 The range of the function is ________________.
Notes Over 1.3 Represent Functions as Graphs • Write a rule for the function represented by the graph. Identify the domain and the range of the function 12 10 8 6 4 2 1 2 3 4 5 6 Each output is 3 less than three times the input 1, 2, 3, and 4 Domain: 0, 3, 6, and 9 Range:
Notes Over 1.3 Represent Functions as Graphs • Write a rule for the function represented by the graph. Identify the domain and the range of the function 12 10 8 6 4 2 2 4 6 8 10 12 Each output is 5 more than half the input 2, 4, 6, and 8 Domain: 6, 7, 8, and 9 Range: