Download
1 / 25
250 likes | 365 Views
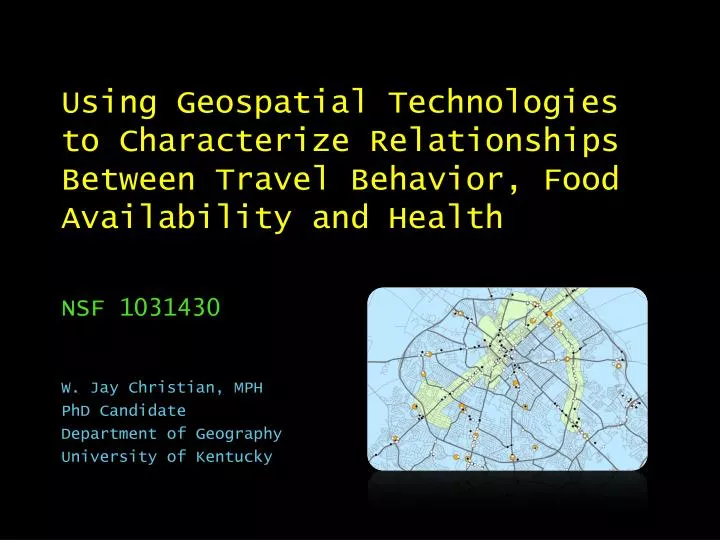
Using Geospatial Technologies to Characterize Relationships Between Travel Behavior, Food Availability and Health. NSF 1031430. W. Jay Christian, MPH PhD Candidate Department of Geography University of Kentucky. Epidemic Obesity in the U.S. 1990. 1999. 2009.

E N D
Using Geospatial Technologies to Characterize Relationships Between Travel Behavior, Food Availability and Health NSF1031430 W. Jay Christian, MPH PhD Candidate Department of Geography University of Kentucky
Epidemic Obesity in the U.S. 1990 1999 2009
Causes of Overweight/Obesity • Genetics • Aging • Diseases • Drugs • Lack of energy balance • More calories in (diet) than out (physical activity) • Environment • Accessibility • Healthful (or unhealthful) food • Facilities that support leisure-time physical activity and/or active transportation
Measuring Overweight/Obesity • Body Mass Index (BMI) BMI = (mass(lb) x 703) (height(in))2 BMI = (mass(kg)) (height(m))2 Underweight<18.5 Normal18.5-24.9 Overweight25.0-29.9 Obese>30.0
Food Accessibility Research • Existing research usually models the spatial accessibility of food based on residential proximity
Food Accessibility Research • Existing research usually models the spatial accessibility of food based on residential proximity • DISTANCE • DENSITY Weight in relation to street network distance between child’s home and nearest fast food restaurant (Burdette & Whitaker 2004) Food stores and restaurants per square mile in census tracts and block groups. (Wang et al. 2007) “Out-of-home eating outlets” per 1000 residents in postal codes and relationship to “deprivation” (Macintyre et al. 2005) Manhattan block distance from census tract centroid to nearest supermarket associated with race (Zenk et al. 2005)
Critiques • No acknowledgement of individualmobility • Mostpeople travel outside the census tract where they live on a daily basis—Mean travel time to work is 25.1 mins!(US Census 2011) • Retail food locations cluster along transportation corridors, near activity centers • Modifiable areal unit problem (MAUP) • Scale and zoning effects influence statistical analysis • Often no direct measurement of diet, food purchasing behaviors
Doctoral Dissertation Research • Develop a model of accessibility based on activity space, rather than residential proximity • Collectdiet and food purchasing data in addition to height/weight • Use ‘off the shelf’ GPS technology to capture activity space • UseGISto link activity spaces with retail food locations
Research Questions • How do residence-based and activity-based models of accessibility differ? • To what extent are diet and food purchasingassociated with activity-based accessibility measures? • How are other individual characteristics related to activity-based accessibility?
Research Protocol • Participantrecruitment (up to 200) via mailed flyers to every residence in Census Tract 5 of Lexington, KY • Telephonecontact to affirm eligibility, schedule meeting for enrollment • Enrollment: consent, Questionnaire 1, GPS orientation, and Q2 scheduling • Three days of GPS logging • GPS debriefing and Questionnaire 2
Census Tract 5 Downtown Bell Court Mentelle UK Kenwick Ashland Park
Participant Recruitment • Six months of recruitment and data collection • May through October, 2011 • Approximately 1400 households received over 3100 flyers via click2mail.com • 121 total participants • 102 (84.3%) with complete 3-day GPS tracks • 7 (5.8%) more with complete 2-day GPS tracks • 12 (9.9%) have GPS tracks with large gaps • 18 participants in 7-day sub-study • Extra funds used to re-recruit • Enables comparison of 3-day and 7-day GPS tracks
Participant Recruitment Residential density Participant density
Data Collection • Questionnaire 1 • Demographics • SES • Mobility • Godin physical activity • GPS • Qstarz 1000XT • 3+ days of tracking • Logging at 3 second intervals • Questionnaire 2 • NHANES Dietary Screener • Food shopping habits • Retail food locations visited during GPS logging • Retail food locations • Obtained from local health department • Coded using NAICS as a guide
Data Management & Processing • GPS data review • Are there 3 full days of data? • Any major gaps that would alter activity space? • Any wildly inaccurate points? • Approximately 10-30 minutes per participant • Qstarz software exports to GPX, KML, CSV, other formats for later analysis in ArcGIS 10 • Questionnairedata entry • REDCap—secure, web-based data management software • Exports to Stata, other lesser formats for statistical analysis
Participant Characteristics RECODE of | strenuous | (STRENUOUS | EXERCISE | times per | RECODE of bmi week) | Under/Nor Overweigh | Total ------------+----------------------+---------- 0 times/wk | 22 22|44 | 50.00 50.00 |100.00 ------------+----------------------+---------- 1+ times/wk | 48 27 |75 | 64.00 36.00 | 100.00 ------------+----------------------+---------- Total | 70 49 | 119 |58.82 41.18 |100.00 Pearson chi2(1) = 2.2440Pr = 0.134 r=0.33 p<0.001 (test for trend)
Activity Space Analysis Activity space (¼ mile buffer GPS track) SupermarketsLimited-service Full-service Insert GPS track map here
Statistical Analysis • How do residence-based and activity-based models of accessibility differ?
Statistical Analysis • To what extent are diet and food purchasing associated with activity-based accessibility?
Statistical Analysis • How are individual characteristics related to activity-based accessibility?
Challenges • Scheduling • Two interviews required, preferably on days immediately before/after GPS logging • Graduate assistant available to help from mid-May till mid-August • GPS accuracy • Weather, especially storms • Human factor • Placement on person, in vehicles, in bags • Remembering to switch device to ‘Log’ • How to ‘fix’ gaps in GPS tracks • Processing & Analysis • ArcGIS 10 • GPS track buffering (crow-fly distances, street network) • Multilevel modeling necessary?
Future Directions • Better dietary assessment • More complete food frequency questionnaire? • Photographs? • Better physical activity measure • Accelerometer or pedometer • UP™ by Jawbone orfitbit™ ultra? • Different contexts • Rural areas, Appalachia? • Transportation systems/mobilities
References United States Census Bureau. 2011. Commuting in the United States: 2009. American Community Survey Reports, ACS-15. U.S. Census Bureau, Washington, DC. Burdette HL, Whitaker RC. Neighborhood playgrounds, fast food restaurants, and crime: relationships to overweight in low-income preschool children. Preventive Medicine, 38: 57-63. Macintyre S, McKay L, Cummins S, Burns C. 2005. Out-of-home food outlets and area deprivation: case study in Glasgow, UK. International Journal of Behavioral Nutrition and Physical Activity, 2: 16. Wang MC, Kim S, Gonzalez A, MacLeod K, Winkleby M. 2007. Socioeconomic and food-related physical characteristics of the neighbourhood environment are associated with body mass index. J of Epidemiol Community Health, 61: 491-498. Zenk SN, Schulz AJ, Israel BA, James SA, Bao S, Wilson ML. 2005. Neighborhood racial composition, neighborhood poverty, and the spatial accessibility of supermarkets in metropolitan Detroit. Am J Public Health, 95:660-667.
Thank you. W. Jay Christian, MPH PhD Candidate Department of Geography jay.christian@uky.com Staff Epidemiologist Markey Cancer Control Program jchrist@kcr.uky.edu