Download
1 / 25
250 likes | 252 Views
This study investigates the intercontinental transport of anthropogenic and biomass burning pollution, specifically ozone, and its impact on global atmospheric chemistry and regional air quality. It includes case studies on ozone maxima over the Middle East and Bermuda, as well as the export efficiency of NOy out of the continental boundary layer.

E N D
Intercontinental Transport of Anthropogenic and Biomass Burning Pollution Qinbin Li Department of Earth and Planetary Sciences Harvard University March 2003
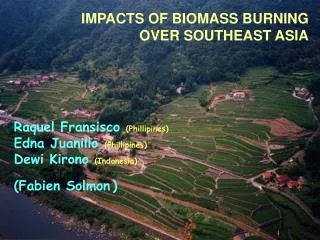
Statement of problem Intercontinental transport of anthropogenic and biomass burning pollution, particularly ozone, could have important impact on global atmospheric chemistry and regional air quality that needs to be better understood and quantified. • Middle East ozone maximum.[Li et al., GRL, 2001] • Springtime ozone maximum at Bermuda.[Li et al., JGR, 2002b] • Export efficiency of NOy out of continental boundary layer. [Li et al., JGR, 2003b] • Transatlantic transport of pollution. [Li et al., 2002a] • Atmospheric budgets of biomass burning tracers HCN and CH3CN. [Li et al., GRL, 2000; Li et al., JGR, 2003a]
Approach • GEOS-CHEM global 3-D model simulation: • Tagged tracers (CO, ozone) • Sensitivity simulation • Tracer correlations Tropical easterly Midlatitude westerly MOZAIC TRACE-P NARE Sonde Sable Island Mace Head Bermuda MIDDLE EAST ASIA NORTH PACIFIC NORTH AMERICA NORTH ATLANTIC EUROPE
GEOS-CHEM and limited observations indicate an ozone maximum over the Middle East circles: ozonesonde/MOZAIC contours: GEOS-CHEM (July 1997) What is the origin of this ozone maximum?
Origin of the Middle East ozone maximum arrows: ozone transport flux contours: ozone production rate GEOS-CHEM, July 1997 • Combination of three factors: • anticyclonic circulation in the middle/upper troposphere with large-scale subsidence over the Middle East. • lightning outflow from the India monsoon and pollution from China transported in an easterly tropical jet. • northern midlatitude pollution transported in the westerly midlatitude jet.
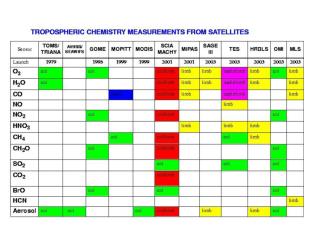
Recent confirmation of the Middle East ozone maximum: SAGE II tropospheric ozone observation July October Climatological ozone mixing ratio at 7 km from SAGE II (1985-90, 1994-99) Kar et al. [2002]
Interpretation of the springtime ozone maximum at Bermuda ? ?Stratospheric [Oltmans & Levy II, 1992,1994; Moody et al., 1995] ? Anthropogenic [Dickerson et al., 1995] GEOS-CHEM reproduces the observed seasonal cycle of surface ozone at Bermuda.
Transport of North American pollution to Bermuda in spring Observations are from S. Oltmans r = 0.82, bias = -1.8 ppb Source attribution in the model Most of surface ozone at Bermuda in spring originates from North American (outflow behind cold fronts); stratosphere contributes less than 5 ppb. Li et al. [2002]
Previous argument for stratospheric origin of ozone at Bermuda from back-trajectory analyses • Oltmans and Levy II [1994]: “On days with high ozone … the trajectories all come from north of 50°N and altitudes near 600 mb.” • Moody et al. [1995]: “High-ozone events are associated with high-speedsubsident flow of North American continental origin.” Moody et al. [1995]
GEOS-CHEM reproduces the association of high ozone at Bermuda with subsiding trajectories from NW March 18, 1996 event: 290 K back-trajectory Subsiding air Cold front Ozone pollution N. America Bermuda Continental ozone pollution mixes with subsiding air behind cold fronts
North Atlantic Regional Experiment (NARE’97): NOy export efficiency (f) out of continental boundary layer Lagrangian:along NARE’97 flight tracks f = 9%, NOx/NOy = 8% [Parrish et al., 2003] Eulerian: NOy export flux out of CBL f = 30%, NOx/NOy = 34% [Liang et al., 1998] Lagrangian mixing model: f = (∆NOy/∆CO) • R • α f : NOy export efficiency ∆NOy, ∆CO: enhancement over background R: anthropogenic emission ratio CO/NOy α: natural CO enhancement in CBL
NOy export efficiency (f) out of the North American boundary layer: NOy-CO correlations along the NARE’97 flight tracks Curves: relationships expected from the mixing model for different values of the export efficiency of NOy (f).
NOy export efficiency (f): Reconciling Eulerian and Lagrangian analyses Liang et al. [1998] f = 30%,NOx/NOy = 34% Eulerian This work f = 11.5±3% Lagrangian, (1) f = 17±7% Lagrangian, (2) f = 17±6%, NOx/NOy = 6±4% Lagrangian, (2) but model ∆CO, ∆NOy f = 20%, NOx/NOy = 39% Eulerian Parrish et al. [2003] f = 9±5%, NOx/NOy = 8% Lagrangian, (1) f = 14.5±11% Lagrangian,(1)butCO = 95 ppb f =17±13% Lagrangian, (2)butNOy = 0.1 ppb (1)background CO =75 ppb, NOy = 0.1 ppb; R = 5.67; α = 1.18[Parrish et al., 2003] (2)background CO =95 ppb, NOy = 0.3 ppb; R = 6.50; α = 1[GEOS-CHEM]
Ozone production due to exported North American anthropogenic NOy GOES-CHEM, September 1997 Half the ozone production takes place in near-field driven by exported NOx; the other half is due to exported PAN over NH. The eventual ozone production due to exported NOy is comparable to direct export of ozone pollution.
Transatlantic transport of North American pollution: Simulated concentrations and fluxes of North American pollution ozone GEOS-CHEM 1997 L April H L July H
Surface ozone at Mace Head, Ireland:North American pollution signal is there but faint Model vs. observed stats, 1993-1997 Time series, Mar-Aug 1997 Observation GEOS-CHEM N. America pollution events in the model Li et al. [2002]
Effect of North American sources on violations of European air quality standard (55 ppbv, 8-h average) GEOS-CHEM, JJA 1997 # of violation days (out of 92) # of violation days that would not have been in absence of North American emissions
Transport of North American pollution to Europe: Correlation with the NAO Index NAOI: normalized surface pressure anomaly between Iceland and Azores North American ozone pollution enhancement at Mace Head, Ireland (GEOS-CHEM) North Atlantic Oscillation (NAO) Index r = 0.57 Greenhouse warming a NAO index shift a change in transatlantic transport of pollution
Intercontinental transport of pollution:Surface ozone enhancements caused by anthropogenic emissions from different continents GEOS-CHEM, JJA 1997 North America Europe Asia
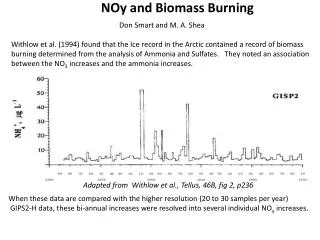
Atmospheric HCN: Tracer for long-range transport of biomass burning pollution? Conventional view: source: biomass burning [Lobert, 1990] sink: reaction with OH lifetime: 2-5 years well mixed: 150-170 pptv [Cicerone and Zellner, 1983] Rinsland et al. [1998] Recent observations indicate a much shorter lifetime (less than a year) – missing sink? Zhao et al. [2000]
Proposed atmospheric budget for HCN (atmospheric lifetime = 2 - 4 months) 26 km HCN + hν < 0.01 Tg N yr-1 HCN + O(1D) < 0.01 Tg N yr-1 HCN + OH 0.1 Tg N yr-1 Tropopause HCN + OH 0.2 Tg N yr-1 HCN Ocean uptake 1.1-2.6 Tg N yr-1 (saturation < 0.85) Biomass burning 1.4-2.9 Tg N yr-1 HCN(aq)/CN- k > 0.2 yr-1 Henry’s law constant (298 K) = 8-12 M atm-1 pKa(HCN(aq)/CN-) = 9.2
TRACE-P observations of background (CO<120 ppb, C2Cl4<10 ppt) HCN and CH3CN: A dominant ocean uptake sink GEOS-CHEM, Feb-Apr 2002 Deposition velocity: 0.13 cm s-1 Saturation ratio: 0.79 for HCN, 0.88 for CH3CN Model reproduces the vertical gradients between MBL and FT.
TRACE-P observations of HCN-CH3CN-CO GEOS-CHEM Feb-Apr 2002 HCN Elevated HCN in Chinese urban plumes. CH3CN Relatively small enhancements of CH3CN in Chinese urban plumes. CO
Atmospheric budgets of HCN and CH3CN GEOS-CHEM 2002 CH3CN is a better tracer for biomass burning.
Summary of results • Middle East ozone maximum is attributed to lightning outflow from India and pollution from China transported in a tropical easterly jet [Li et al., GRL, 2001]. • The springtime ozone maximum at Bermuda is attributed to boundary layer outflow of North American pollution behind cold fronts, not to stratospheric sources [Li et al., JGR, 2002b]. • Export efficiency of NOy out of continental boundary layerfrom Eulerian and Lagrangian approaches are consistent (~20%). Ozone production due to exported NOy is comparable to direct export of ozone pollution [Li et al., JGR, 2003b]. • Transatlantic transport of pollution: North American anthropogenic emissions enhance surface ozone in Europe by 2-5 ppb on average in summer which is important for European air quality standard. The NAO index is a predictor for transatlantic transport of North American pollution [Li et al., JGR, 2002a]. • Atmospheric budgets of HCN and CH3CN: ocean uptake is a dominant sink for both HCN and CH3CN; CH3CN is a better biomass burning tracer [Li et al., GRL, 2000; Li et al., JGR, 2003a].