Download
1 / 62
630 likes | 731 Views
International Wood Energy Market Developments. Ed Pepke Forest Products Marketing Specialist UNECE/FAO Timber Section, Geneva. Subjects. Overview of forest products market developments Market drivers Policy drivers Wood energy markets Conclusions Recommendations Questions and discussion.

E N D
International Wood Energy Market Developments Ed Pepke Forest Products Marketing Specialist UNECE/FAO Timber Section, Geneva
Subjects • Overview of forest products market developments • Market drivers • Policy drivers • Wood energy markets • Conclusions • Recommendations • Questions and discussion
Main sources of information W W W W W W W W W W W W • UNECE/FAO Forest Products Annual Market Review, 2007-2008 • UNECE/FAO Forest resources assessment • UNECE/FAO Timber database • FAO Statistics • State of Europe’s Forests 2007 by Ministerial Conference for the Protection of Forests in Europe, November 2007
“United States forest products market crashimpacts UNECE region” • In 2007, US housing construction continued its sharp decline, severely impacting world markets. • Green building systems are a market driver, but also a constraint. • UNECE region consumption of wood and paper products fell in 2007 for the first time in 6 years (downturn in North American overcoming a rise in European and CIS). • Oil prices soared, stimulating wood-based biofuels and policies to mobilize more wood from both forests and other sources. • Certified forest area rose to over 300 million hectares worldwide.
UN Economic Commission for Europe region Europe 42 North America 2 Commonwealth of Independent States, 12
“US forest products market crashimpacts UNECE region” • Some European market sectors exceeded their North American counterparts: production of sawn softwood and consumption of panels and paper and paperboard. • China’s trade with countries in the UNECE region continues to increase. • In Europe, wood products prices generally rose in 2007, then fell in 2008 as markets weakened • In North America prices for some wood products, such as sawnwood dropped to their lowest levels since 1991. • Russian export taxes on roundwood are disrupting supply and changing trade patterns.
II. Market drivers • US housing market • Energy prices • Russian export taxes • China’s trade
United States housing starts • US residential housing: 2.2 million homes in 2006 • 2008: under 1 million, -40% • Recovery beginning 2010 (NAHB) Source: US Census Bureau, 2008.
Oil prices • Rising fossil fuel costs driving wood energy • Spike at $145/barrel in July 2008 • Pellet production in Europe, Canada, Russia • Competition with wood industry • Concern for sustainability certification • Biofuels vs. food wood Source: US Department of Energy, 2008.
Russian exports & taxes • Roundwood export tax • 2008 €15/m3 • 2009 €50/m3 • Log exports to Europe down 44% in early 2008 • With new Forest Code • Autonomy to regions • Attracting foreign investment • Value-added processing • Illegal harvesting and exports Source: UNECE/FAO TIMBER database, 2008
China’s forest products output impacts • Impacting every market sector • Roundwood imports profit UNECE region exporters • European roundwood exports affect sawmills • China’s exports benefit consumers • European, American manufactures impacted • Graph does not include furniture Source: International Wood Markets Group, 2008
Chinese furniture exports • $22 billion 2007, total furniture exports • $11 billion, wooden furniture exports • $69 billion, total furniture production • 66% of production for domestic market • 2,322 manufacturing plants • Most plants have some foreign investment Source: IBISWorld, 2008 and Tan,X. et al., 2007
Chinese forest products production Source: International Wood Markets Group, 2008
Chinese forest products imports Source: International Wood Markets Group, 2008
Chinese forest products exports Source: International Wood Markets Group, 2008
Chinese forest products consumption Sources: FAOStat, 2008 and Tan, X., et al, 2007.
III. Policy drivers • Climate change • Carbon markets • Wood energy, biofuels vs food • Green building • Deforestation • Corporate responsibility • Illegal logging and trade
Policies can level or distort the playing field • Laws, duties, tariffs, taxes, regulations • Raw material costs • Labour costs & benefits • Manufacturing costs • Goal: Raise standard of living and domestic consumption of and paper wood products
Climate change • UN Intergovernmental Panel on Climate Change: “evidence of a warming trend is unequivocal” • Policies mitigating climate change • National and sub-national governments • International organizations • Trade associations • Non-governmental organizations
Climate change • 17.4% of global greenhouse gas emissions caused by humans are from forestry, mainly deforestation • Direct links between sustainable forest management and climate change • EU targets for 2020 • 20% renewable energy • 20% improved energy efficiency
Factor “X” for forests: Climate change • Greenhouse effect on growth? • Species substitution? • Storms and their damage? 1999 Source: UNECE/FAO Forest Products Annual Market Review
Storm damage in Swiss forests, 1972-2005 Cumulative (CHF millions) Annual losses (CHF millions) Source: Institute fédérale de Recherche Suisse, 2007
Carbon markets • Active forest management reduces carbon emissions • Following Kyoto Protocol, carbon trading established • Pulp and paper industry included in the EU Emissions Trading Scheme • Future in marketing carbon sequestration in forests and products of wood and paper?
Wood energy policies • Targets for wood energy • European and North American • Must be balanced with current and future availability from forests • Must be balanced with wood processing industry needs • 60% of annual growth in European forests harvested • 80% in North America • 34% in Russia
Food security Food shortages Production of liquid biofuels from food crops Wood-based biofuels do not compete with food Forests, including harvesting residues Wood processing residues Recycling of wood and paper products Biofuels versus food
Green building systems • New market • New market driver Photo: APA.
Deforestation • Issue plaguing the forest sector • Consumers confused between tropical deforestation and state of forests in Europe • Strong policies in UNECE region for sustainable forest management
Change in annual forest area, 1990-2000 Asia & Pacific Europe North America Mideast Africa S. America Central America Source:FAO Global Forest Resources Assessment 2000
Change in annual forest area, 1990-2000 (million hectares) Note: The change in annual forest area was recalculated at -7.3 million ha per year from 2000 to 2005 by the FAO Global Forest Resources Assessment in 2005. Source:FAO Global Forest Resources Assessment 2000
Causes of deforestation • Forest conversion • Agricultural, including • Pastures for animals • Bioenergy plantations: palm oil, sugar cane • Urbanization • Unsustainable forest management • Poor harvesting practices • Insufficient regeneration • Fire, insects, disease • Over harvest of fuelwood • Poverty and over population
Forest resources growing stock Source: UNECE/FAO Forest Resources Assessment 2005
Net annual growth vs. fellings Source: UNECE/FAO Forest Resources Assessment 2005
Forest resources in Europe* • Only 60% of the annual growth is harvested • Forest volume increases ~700,000 m3 daily • Forest area growing: ~700,000 ha annually * Europe = 42 countries for the UN Economic Commission for Europe Source: UNECE/FAO Forest Resources Assessment
Timber Committee: corporate social responsibility • Trade associations issuing codes of conduct • Companies developing CSR policies to demonstrate their positive social impact • CSR policies are a means to • Shape consumer perceptions • Gain competitive edge • Improve international recognition and perception • Mutual recognition of trade associations’ CSR policies could facilitate trade.
Illegal logging and trade • G8 • “support existing processes to combat illegal logging” • “one of the most difficult obstacles to further progress in realizing sustainable forest management and thereof , in protecting forests worldwide” • Legislation in US and EU • Trade associations establishing and updating codes of conduct • UK TTF proactively made members establish “due diligence risk assessment systems” • Timber Trade Action Plan coordinates associations
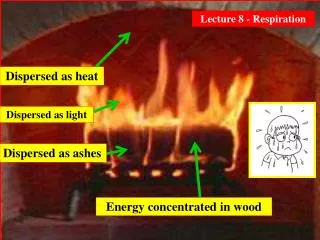
IV. Wood energy markets (the oldest and newest market) Nice discovery Og, but what about global warming?
Wood energy markets • Driven by high fossil fuel costs • Driven by policies to promote renewable energies • 20% by 2020 in EU • 10% of transport fuels by 2020 in EU • Driven by policies for energy security Renewable energy in European Union, 2005, 2011, 2020
Wood energy markets • Similar targets in North and South America, Asia, Oceania and Africa • US target of 15% biofuels for transport by 2022 • US target of 30% by 2030 • Most energy demand for space and water heating • Wood pellet industry growing • Warm winters of 2006/2007, 2007/2008 oversupply • Transportation costs, especially Canada to Europe • Future: cellulosic ethanol
Pellet consumption et production Source: Canadian Wood Pellet Association, 2007
Wood fuel production Sources: UNECE/FAO TIMBER database, UNECE Timber Committee forecasts, October 2007
French fuelwood production 2006. New French study on consumption and production. Old statistics not yet corrected. Sources: UNECE/FAO TIMBER database, and UNECE Timber Committee forecasts, October 2007
Situation today • Record high petroleum prices • Energy sources security problems • Climate change policies • Wood industries’ raw material needs increasing • Wood energy production increasing • Roundwood and residue prices increasing
Utilization of biomass in the EU Wood 80% Source: EurObserv'ER, 2007
Wood for the wood-based industries • Increasing demand forecast • Wood raw material prices climbing • Competition for roundwood and residues • Local and regional • Short-term intense! • Medium term?
Demand for wood and fibre in western Europe, without energy, 1960-2020 Gap = residues Growth in demand without energy Source: UNECE/FAO European Forest Sector Outlook Study, 2005 WRME = Wood raw material equivalent
Results of a UNECE/FAO study on“Wood resources availability and demands:Implications of renewable energy policies” • Wood is the major renewable energy source in Europe • Woodfuel consumption much greater than previously measured • Lack precise statistics • Increasing wood energy changes long-term forecasts for the sector’s wood needs
Dilemma or opportunity?(million m3) Source: UNECE/FAO“Wood resources availability and demands: Implications of renewable energy policies”, 2007.
How to fill the “gap” • Increase harvests from European forests • More of annual growth • More standing timber • Remove more biomass from forests • Tree tops • Branches, needles, leaves • Harvest wood outside forests (urban, hedgerows) • Increase wood recycling and residue reuse • Import biomass, wood fuels • Improve energy use efficiency
Possible consequences of a future gap • Renewable energy targets not achieved • Goals achieved, but not only with wood • Other sources of biomass • Other renewable energy sources • Wood industry growth slowed • Raw material unavailable • Price of raw material too expensive