Download
1 / 11
110 likes | 221 Views
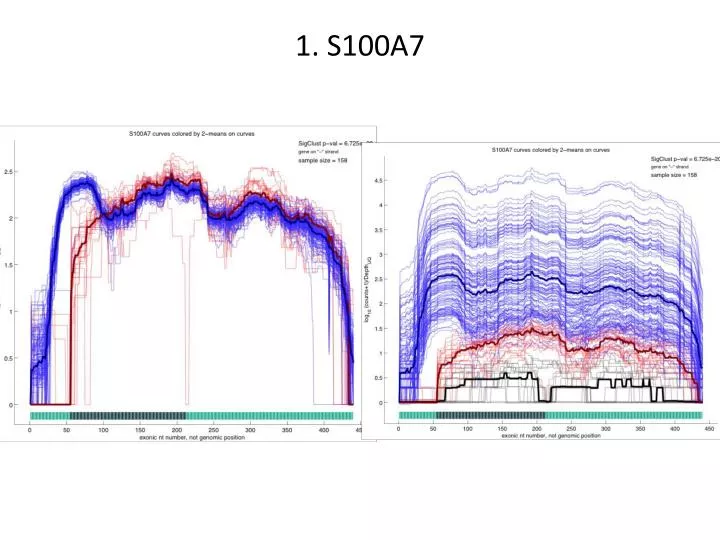
1. S100A7. 1. S100A7. 110624_UNC11-SN627_0111_BD0CT8ABXX_4_. 110223_UNC9-SN296_0154_B81LPPABXX_6_. scale = 0-461. blue. scale = 0-30. red. chr1:153,430,220-153,433,137. 2. SPRR2A. 2. SPRR2A. 110630_UNC11-SN627_0112_AD0CVJABXX_8_. 110308_UNC9-SN296_0157_AB05N2ABXX_5_. scale = 0-12507.

E N D
1. S100A7 110624_UNC11-SN627_0111_BD0CT8ABXX_4_ 110223_UNC9-SN296_0154_B81LPPABXX_6_ scale = 0-461 blue scale = 0-30 red chr1:153,430,220-153,433,137
2. SPRR2A 110630_UNC11-SN627_0112_AD0CVJABXX_8_ 110308_UNC9-SN296_0157_AB05N2ABXX_5_ scale = 0-12507 red scale = 0-309 blue chr1:153,028,596-153,029,988
3. UGT1A10 UGT1A10 exons 110218_SN254_0194_B81D2DABXX_5_ 110427_UNC11-SN627_0080_AC016RABXX_5_ scale = 0-973 blue scale = 0-892 red chr2:234,526,291-234,681,945
8. KLK12 previously 159/195
8. KLK12 110624_UNC14-SN744_0134_AD0CVTABXX_3_ 110214_SN627_0059_A81fmwabxx_4_ scale = 0-487 red scale = 0-571 blue chr19:51,532,348-51,538,148
8. KLK12 110426_UNC10-SN254_0213_BB065FABXX_5_ 110624_UNC11-SN627_0111_BD0CT8ABXX_7_ highest curves scale = 0-5504 red scale = 0-12306 blue chr19:51,532,348-51,538,148
Matlab code (for Patrick) data = textread('/Users/pkimes/Desktop/S100A7_coverage.txt') ; data = data' ; [d,n] = size(data) ; medcov = zeros(n,1) ; percov = zeros(n,1) ; for i = 1:n ; temp = data(:,i) ; tempflag = (temp == 0) ; percov(i) = 1 - sum(tempflag)/d ; medcov(i) = median(temp(~tempflag)) ; end ; medcov(isnan(medcov)) = 0 ; flag = (medcov < 5) | (percov < .10) ; sum(~flag) coverage = sum(data,1) ; datanorm = data(:,~flag) ./ ... vec2matSM(coverage(~flag)+1,d) ... * median(coverage(~flag)) ; logdata = log10(datanorm+1) ; paramstruct = struct('npc',1,... 'iscreenwrite',1,... 'viout',[0 0 0 0 1]) ; outstruct = pcaSM(logdata,paramstruct) ; vpc = outstruct.mpc ; vclass = kmeans(vpc',2,'EmptyAction', ... 'singleton','Replicates',10) ; labSF = logical(vclass-1) ; sum(labSF) sum(~labSF) testn1 = sum(labSF) ; testn2 = sum(~labSF) ; testn0 = n - (testn1+testn2) ; datanorm2 = (data+1) ; logdata2 = log10(datanorm2) ; screen = find(~flag) ; c1 = find(flag) ; c2 = screen(labSF) ; c3 = screen(~labSF) ; medn1 = median(logdata2(:,c1),2) ; medn2 = median(logdata2(:,c2),2) ; medn3 = median(logdata2(:,c3),2) ; fid = fopen('/Users/pkimes/Desktop/samplenames177.txt') ; output = textscan(fid,'%s') ; fclose(fid) ; samples = output{1} ; sdiff1 = sum(abs(logdata2(:,c2) - vec2matSM(medn2,length(c2))),1) ; good1 = find(sdiff1 == min(sdiff1)) sdiff2 = sum(abs(logdata2(:,c3) - vec2matSM(medn3,length(c3))),1) ; good2 = find(sdiff2 == min(sdiff2)) figure(1) ; clf ; hold on ; plot(logdata2(:,c1),'-','color',[.4 .4 .4]) ; plot(logdata2(:,c2),'-','color',[1 .3 .3]) ; plot(logdata2(:,c3),'-','color',[.3 .3 1]) ; plot(medn1,'-','color',[0 0 0],'linewidth',3) ; plot(medn2,'-','color',[.6 0 0],'linewidth',3) ; plot(medn3,'-','color',[0 0 .6],'linewidth',3) ; plot(logdata2(:,c2(good1)),'-g','linewidth',5) ; plot(logdata2(:,c3(good2)),'-g','linewidth',5) ; samples(c2(good1)) samples(c3(good2)) area1 = sum(logdata2(:,c2)) ; top1 = find(area1 == max(area1)) ; area2 = sum(logdata2(:,c3)) ; top2 = find(area2 == max(area2)) ;